
Figures & data
Figure 1. Salinomycin inhibits stemness, reduces spheroids formation, and induces apoptosis in colon cancer stem cells. (a) CD133 surface expression was analysed by FACS in DLD-1, SW620 cells. SW620 cells were treated with either salinomycin (10 µM) or cisplatin (10 µM) for 24 h and analysed by FACS for (b) CD133 expression and (c) ALDH activity. (d) DLD-1 cells and SW620 cells were treated with increasing doses (2.5–20 μM) of salinomycin and cisplatin for 48 h and subjected to SRB assay to assess their growth inhibitory response. Details are described in methodology section 2.3. Data points are average of triplicate readings of samples; error bars, ± S.D. *p < 0.01, compared to cisplatin-treated cells. (e) The expression of CD133 and cytokeratin 20 (CK20-upper band) in DLD-1 cells were determined in both adherent (2D) and non-adherent (3D) culture by Western blot analysis. (f) DLD-1 cells were plated at 50,000 cells per 9.04 cm2 dish in a non-adherent plate. Cells were treated with vehicle/salinomycin (5 µM)/cisplatin (5 µM) and allowed to grow under 3D condition. After 72 h, their corresponding photo micrographs (10x10 magnification) are captured and shown (g). The effect of salinomycin and cisplatin in cell viability of spheroids were determined by trypan blue assay. Data points are average of triplicate readings of samples; error bars, ± S.D. *p < 0.01, compared to vehicle-treated cells. (h) Represents the FACS dot plot analysis of Annexin-V staining in CD133 gated population in the vehicle/salinomycin (10 µM)/cisplatin (10 µM) treated SW620 cells. Results shown from (a) to (h) sections are representative of at least three independent experiments
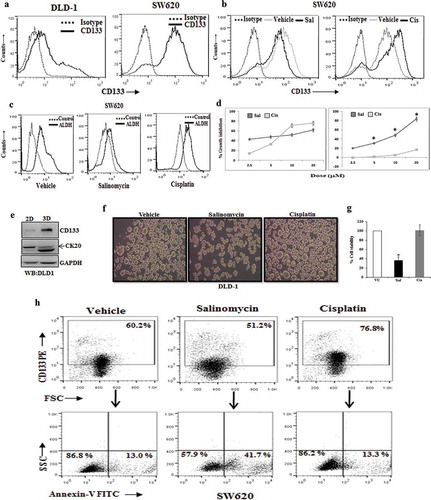
Figure 2. Salinomycin promotes the expression of DR4 and DR5 in colon cancer stem cells and sensitizes them for TRAIL-induced apoptosis. (a) Human proteome profiler apoptosis array was performed in vehicle and 10 µM of salinomycin treated SW620 cells. Array spot coordinates for target proteins in duplicates were enlisted in right-hand panel. (b) Shows the heat map of respective proteins based on the pixel density of corresponding dots in vehicle and salinomycin treated groups. (c) The Western blot analysis of DR4, DR5, and GAPDH in vehicle- and salinomycin-treated SW620 (top) LOVO (bottom) cells; representative of at least three independent experiments. (d) SW620 and LOVO cells were treated with vehicle and salinomycin (10 µM) for 24 h and dual stained with either fluorochrome-conjugated CD133 or DR4 or CD133 and DR5 antibodies or matched isotype control and subjected to FACS analysis. Histogram overlays displaying the expression of either DR4 (top) or DR5 (bottom) in CD133 gated population of SW620 and LOVO cells, representative of at least three independent experiments. (e) SW620 (top) and LOVO (bottom) were pre-treated with salinomycin for 12 h followed by TRAIL treatment for 36 h and subjected to SRB assay. Results are representative of three independent experiments. Columns, an average of triplicate readings of samples; error bars, ± S.D. *, p < 0.05, compared with only 10 ng/ml TRAIL-treated cells; whereas, #, p < 0.05, compared with only 50 ng/ml TRAIL-treated cells
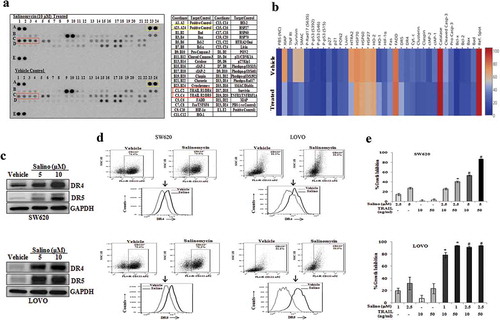
Figure 3. Salinomycin up-regulates the transcriptional expression of DR4 and DR5 genes by targeting EZH2. SW620 cells were treated with either vehicle, or salinomycin (10 μΜ) or cisplatin (10 μΜ) for 24 h and subjected to (a) RT-PCR analysis. SW620 cells were treated with either vehicle, or salinomycin (10 μΜ) and performed (b) Western blot for SP1, p53, YY1, GAPDH, β-actin. (c) SW620 cells were treated with DzNep (10 μΜ), 5-Azacytidine (5 μΜ), Trichostatin-A (1 μΜ) for 24 h followed by western blot analysis for DR4, DR5, and GAPDH protein expression. (d) SW620 cells were treated with vehicle and salinomycin (10 μΜ) followed by western blotting for EZH2 and GAPDH. (e) SW620 cells were treated with either vehicle, or salinomycin (10 μΜ) or cisplatin (10 μΜ) for 24 h and nuclear and cytoplasmic were prepared. Nuclear lysates were subjected to Western blot analysis for EZH2, PCNA, H3K27me3, and total H3 expression, whereas, EZH2 and GAPDH expression were determined in cytoplasmic fraction (Left Panel); Confocal microscopy was performed for corresponding changes in EZH2 and global H3K27me3 level after vehicle or 10 µM salinomycin treatment for 24 h (E, right first and second panel). In similar setting, simultaneous expression of EZH2 and DR5 were assessed by confocal microscopy (E, right third panel). Results shown in A−E are representative of at least three independent experiments. (f) SW620 cells were treated with 1 and 5 µM doses of GSK-343 and 10 µM dose of EPZ6438 and examine the expression of EZH2, H3K27me3, DR4, DR5, and GAPDH by western blot. (g) SW620 cells were treated with either vehicle or 10 µM dose of EPZ6438 and performed q-PCR analysis for DR4 and DR5 expression. Data points are average of duplicate readings of samples; error bars, ± S.D. *p < 0.01, compared to vehicle-treated cells (h). Control (Empty Vector) and EZH2 knockdown stable cells (SW620) were analysed for expression of EZH2, H3K27me3, DR4, DR5, and GAPDH by western blot. SW620 cells were treated with either vehicle or GSK-343 for 24 h and (i) dual stained with either FITC conjugated Annexin-V, and APC conjugated CD133 or (j) PE-conjugated DR4/DR5 and APC conjugated CD133 antibodies followed by FACS analysis. Results shown from (a–j) are representative of at least three independent experiments
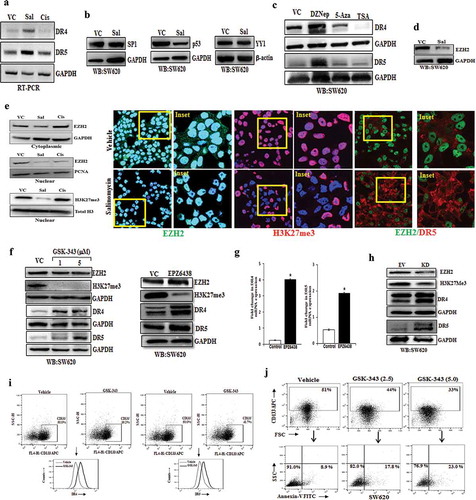
Figure 4. Salinomycin and EZH2 inhibitor remove H3K27me3 marks near the promoters of DR4 and DR5 genes. (a) H3K27me3 marks occupy DR4 promoter. ChIP was performed in SW620 cells using anti H3K27me3 and IgG antibodies and then examined by real-time q-PCR using primers pairs targeting −1.5 Kb to +1 Kb of the DR4 gene. The X-axis indicates the central location of the PRC products relative to the DR4 TSS. (b–g) ChIP analysis showing differential fold change in H3K27me3 level at the promoter of DR4 gene in SW620 cells treated with either vehicle or salinomycin (10 µM) or EPZ6438 (10 µM) for 24 h. (h) H3K27me3 marks occupy DR5 promoter. ChIP was performed in SW620 cells using anti H3K27me3 and IgG antibodies and then examined by real-time q-PCR using primers pairs targeting −1.5 Kb to +1 Kb of the DR5 gene. The X-axis indicates the central location of the PRC products relative to the DR5 TSS. (i–o) ChIP analysis showing differential fold change in H3K27me3 level at the promoter of DR5 in SW620 cells treated with either vehicle or salinomycin (10 µM) or EPZ6438 (10 µM) for 24 h. Results shown (a–o) are representative of two independent experiments. Columns, an average of duplicate readings of samples; error bars, ± S.D. *, p < 0.05, compared to vehicle-treated cells
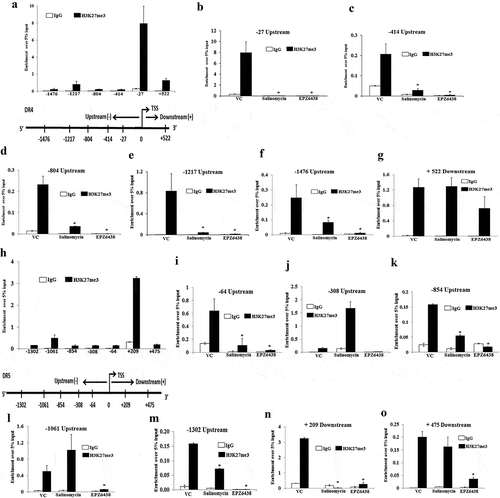
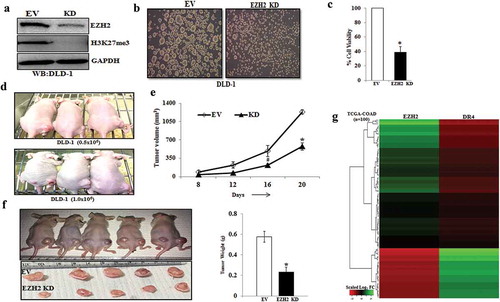
Figure 5. EZH2 knockdown inhibits CSC properties in-vitro and in-vivo and inversely correlated with DR4 expression. (a) Stable Empty Vector (EV) and EZH2 knockdown (KD) DLD-1 cells were analysed for expression of EZH2, H3K27me3, and GAPDH by western blot. (b) EV and EZH2 KD DLD-1 cells were plated at 50,000 cells per 9.04 cm2 dish in a non-adherent plate and allowed to grow under 3D condition. After 72 h, their corresponding photo micrographs are shown. (c) Trypan blue assay for per cent cell viability in empty vector (EV) and EZH2 KD spheroid colonies. Data points are average of triplicate readings of samples; error bars, ± S.D. *p < 0.01, compared to control cells. Results shown from (A) to (C) sections are representative of at least three independent experiments. (d) EV and EZH2 KD DLD-1 cells at different dilutions (0.5x10⁶ and 1 × 10⁶) in 100 μL PBS were subcutaneously inoculated in the right (EV) and left (KD) flank of each 4- to 6-week-old nude Crl: CD1-Foxn1nu mice (n = 3). After 2 weeks, photograph of tumour-bearing mice were captured and represented. (e) EV and EZH2 KD DLD-1 cells (2x10⁶) in 100 μL PBS were subcutaneously inoculated in the right (EV) and left (KD) flank of each 4- to 6-week-old nude Crl: CD1-Foxn1nu mice (n = 5) and allowed them grow for 21 days. Growth curve is shown for EV and EZH2 KD; points are indicative of average value of tumour volume; bars, ± SD. The EZH2 KD group had significantly lower average tumour volumes from the EV group (#, p < 0.05; *, p < 0.01). (f) Representative images of tumour-bearing mice and harvested tumours were shown (left panel). Average weight of harvested tumours bars, ± SD of EV and EZH2 groups (*, p < 0.05) depicted by bar graph (right panel). (g) The heat map was generated to evaluate the correlation between EZH2 and DR4 mRNA signature in a segregated subset of high EZH2 (n = 73) and low EZH2 (n = 27) from COAD cohort of colon cancer patient data derived from TCGA database
Supplemental Material
Download PDF (282.4 KB)Data availability
Data will be made available upon reasonable request.