
Figures & data
Figure 1. Flowchart of the analysis of the integration of DNA methylation and expression data for mRNA as well as miRNA
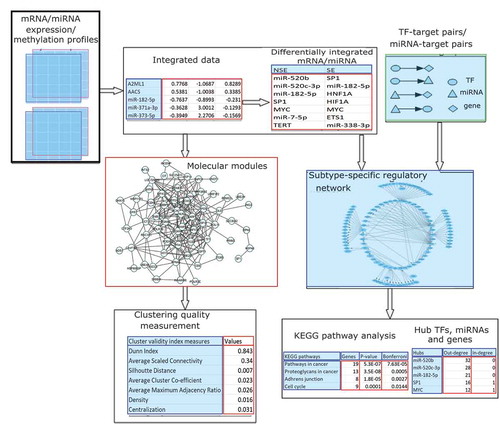
Table 1. Up-regulated and down-regulated genes in ‘greenyellow’ module (NSE versus SE, |logFC| >0.5)
Table 2. Different cluster validity index measures during the module detection through average linkage clustering
Figure 2. Differentially expressed and methylated (DEM) module analysis in two subtypes: non-seminoma (NSE) and seminoma (SE). a. Soft threshold power for NSE versus SE. The first sub-figure (left) presents soft threshold (power) (in x-axis) versus scale-free topology fit, signed R^2 (in y-axis) plot, where the red horizontal line signifies the lower borderline of the standard value of scale-free topology fit, signed R^2 to maintain the scale-free topology. In this study, we obtained power 3 for this purpose. The second sub-figure (right) denotes soft threshold (power) (in x-axis) versus mean connectivity (in y-axis) plot. b. Gene dendrogram and module colours for NSE versus SE obtained by using dynamic tree cut method. The entire tree is cut at default height (0.99). Each colour signifies an individual resultant module
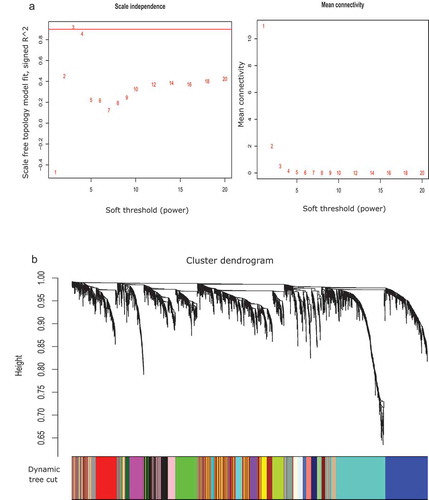
Figure 3. Co-expression module (‘greenyellow’ module, PCC: 0.6). Each node denotes an individual biomolecule where each edge signifies that the connecting node-pair has significant PCC (>0.6 or <-0.6). Insignificant PCC (0.6 or
-0.6) between any node-pair signifies that there is no connecting edge between the node-pair
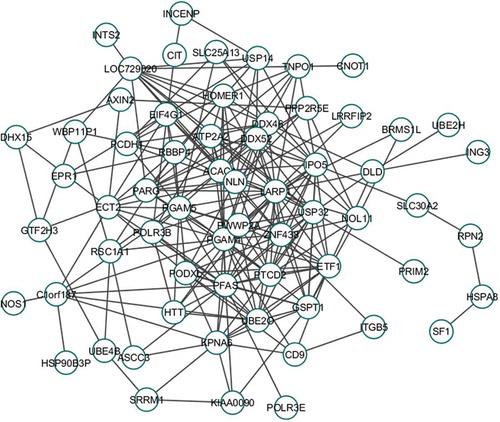
Figure 4. Silhouette Width plot for NSE versus SE. The x-axis denotes Silhouette Width ([0, 1]) and y-axis denotes each individual cluster. The average Silhouette Width is obtained as 0.01
![Figure 4. Silhouette Width plot for NSE versus SE. The x-axis denotes Silhouette Width ([0, 1]) and y-axis denotes each individual cluster. The average Silhouette Width is obtained as 0.01](/cms/asset/b52eaef0-bbd1-4ac3-bae1-608d6a720ec1/kepi_a_1790108_f0004_b.gif)
Table 3. Statistics of regulation pairs in TGCT NSE and SE subtypes (PCC > 0.6, p-value <0.05)
Figure 5. Subtype-specific regulatory networks related to Thyroid hormone signalling pathway. The molecules with red borders were related to the pathway. (a) The mentioned NSE-specific network. (b) The mentioned SE-specific network
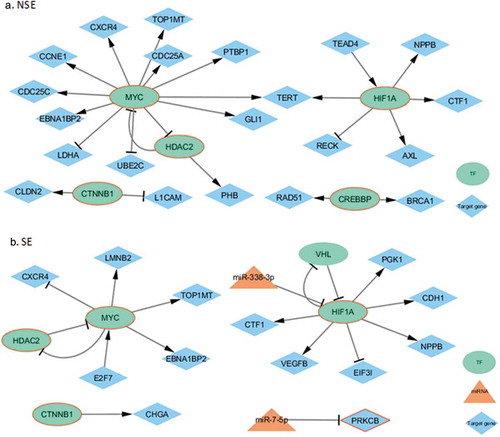
Table 5. KEGG pathway enrichment analysis of subtype-specific regulatory network genes using DAVID
Table 4. Hubs in subtype-specific regulatory networks with respect to in-degree and out-degree centralities