
Figures & data
Figure 1. Whole Genome Bisulphite Sequencing (WGBS) and RNA-seq Bioinformatics Pipeline WGBS and RNA-seq pipelines were processed separately. The goal of the pipelines was to identify differentially methylated CpG sites or regions and to categorize affected pathways by Decitabine exposure. Linux command line, R studio, and Ingenuity Pathway Analysis by Qiagen were used for data analysis
Figure 2. Weekly body weight measurements. Weekly body weight was measured to assess acute toxicity. No significant changes in body weight were observed within individuals or between treatment groups
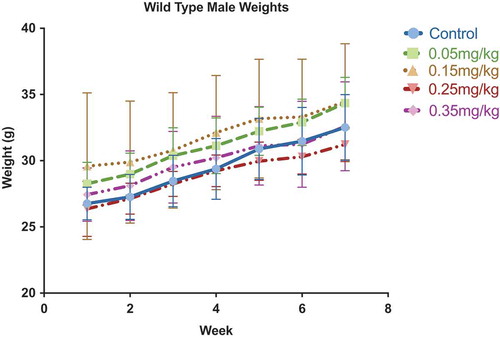
Figure 3. bone marrow and spleen histology analysis of both sternum bone marrow and spleen showed no signs of toxicity in groups 0.0–0.25 mg/kg. Bone marrow from 0.35 mg/kg mice shows moderate increments in the erythroid to myeloid ratio with emperiopolesis present, indicated with black arrows (i). (a) Bone Marrow 0.0 mg/kg treatment. (b) Spleen 0.0 mg/kg treatment. (c) Bone Marrow 0.05 mg/kg treatment. (d) Spleen 0.05 mg/kg treatment. (e) Bone Marrow 0.15 mg/kg treatment. (f) Spleen 0.15 mg/kg treatment. (g) Bone Marrow 0.25 mg/kg treatment. (h) Spleen 0.25 mg/kg treatment. (I) Bone Marrow 0.35 mg/kg treatment. (j) Spleen 0.35 mg/kg treatment. All bone marrow fields are H&E 20X magnification and all spleen fields are H&E 10X magnification
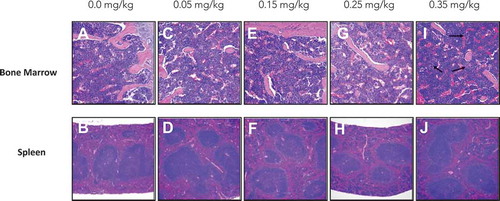
Figure 4. Testes Weight and Sperm Concentration Lower testes weight is coupled with decreased sperm concentration as DAC dose intensifies. (a) Testes weight was significantly affected between control and all doses. (b) Sperm concentration decreased as decitabine dose increased. Single stars indicate p-values<0.05, when compared to controls. Bars represent standard error. Sperm concentration is based off individual sperm count within a 40x magnification field view
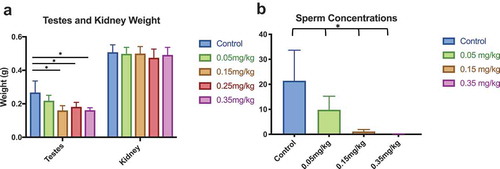
Figure 5. Differential methylation across DAC dose and tissue identified from WGBS data liver and testes tissues at doses 0.0, 0.15, and 0.35 mg/kg were assessed for differential DNA methylation by decitabine exposure using WGBS data. Differential methylation was identified by using the 2-group Wald test model in the DSS R package. Overlap of DMCs and DMRs were identified in both liver and testes samples using Linux (UNIX)
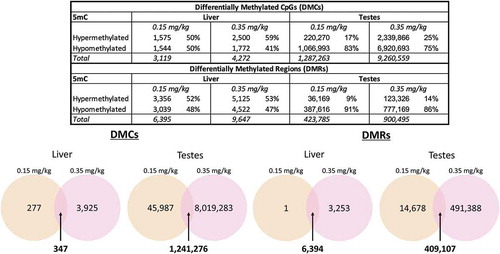
Figure 6. Annotated genic regions in liver and testes distribution of DMRs within (a) genic regions of 0.15 and 0.35 mg/kg testes, (b) 0.15 and 0.35 mg/kg liver. Annotated data is plotted against a randomized set of regions
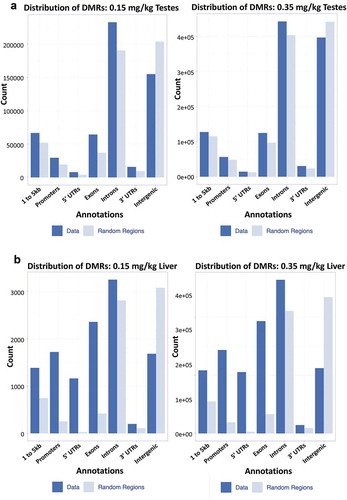
Figure 7. Differential methylation of liver and testes by DAC exposure proportional hypo- and hypermethylated regions within 0.15 and 0.35 mg/kg in testes, 0.15 and 0.35 mg/kg in liver
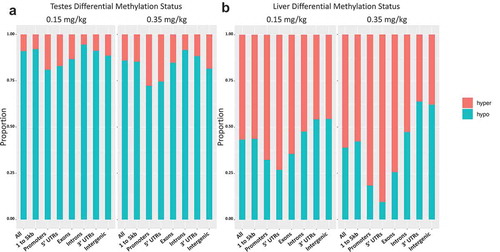
Figure 8. Mouse LINE (mLINE) DNA Methylation in Liver, Testes, Cortex, and Hippocampus Effect of DAC exposure on mLINE methylation. (a) Liver. (b) Testes. (c) Cortex. (d) Hippocampus. mLINE methylation increases with higher DAC exposure in Testes, and partially increases within Liver tissue. Lower methylation induced by DAC exposure is only found in position 4 of liver tissue. Single stars indicate p-values<0.05, when compared to controls. Error bars indicate standard error
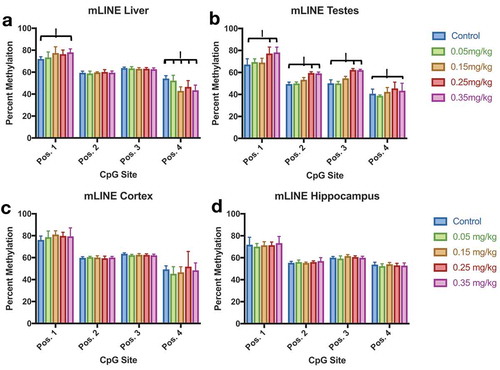
Figure 9. IAP DNA Methylation Effect of DAC exposure on Global IAP methylation. (a) Liver. (b) Testes. (c) Cortex. (d) Hippocampus. Testes methylation increases at CpG position 1 and position 3 in groups 0.25 mg/kg and 0.35 mg/kg, but not within lower doses of DAC exposure. Single stars indicate p-values<0.05, when compared to controls. Error bars indicate standard error
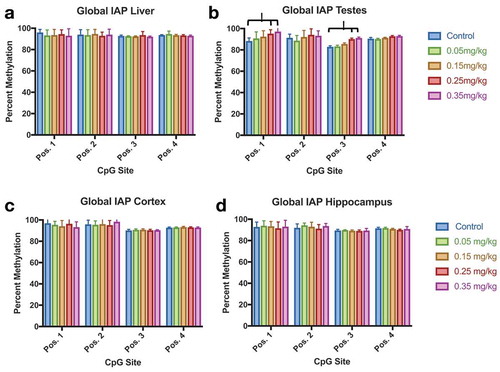
Figure 10. Igf2 DNA methylation in liver, testes, and cortex effects of DAC exposure on Igf2 locus methylation. (a) Liver. (b) Testes. (c) Cortex. Igf2 methylation significantly decreased within testes at all CpG positions, whereas liver is only slightly affected by different doses within two positions. Single stars indicate p-values<0.05, when compared to controls. Error bars indicate standard error
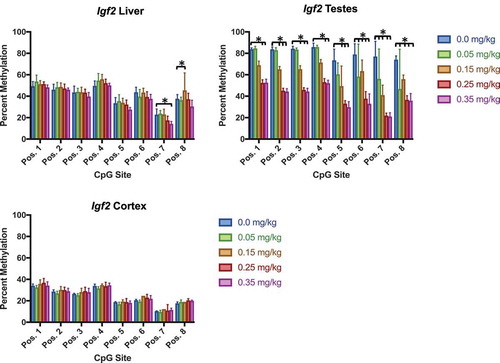
Figure 11. Tcf3 methylation in liver, testes, cortex, and hippocampus effect of DAC exposure on CpG site methylation within Tcf3. (a) Liver. (b) Testes. (c) Cortex. (d) Hippocampus. DAC exposure induces dose-specific hypomethylation within Testes, but is not present in liver, cortex, or hippocampus. Single stars indicate p-values<0.05, when compared to controls. Error bars indicate standard error
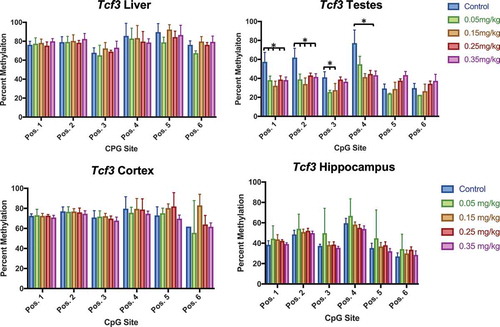
Figure 12. Blood DNA methylation at three time points effect of DAC exposure on Tcf3 blood methylation. Blood was collected before dosing (week 0), mid-way through exposure (week 4), and at the time of death (week 7). (a) 0.0 mg/kg dose. (b) 0.05 mg/kg dose. (c) 0.15 mg/kg dose. (d) 0.25 mg/kg dose. (e) 0.35 mg/kg dose
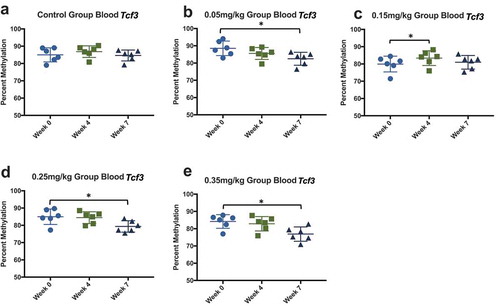
Table 1. Differential gene expression in liver and testes. Higher doses of DAC induced greater dysregulation of gene expression. Testes had greater dysregulation of gene expression in both 0.15 and 0.35 mg/kg doses, while liver had tighter regulation of dysregulation in both doses. (n = 3 per treatment)
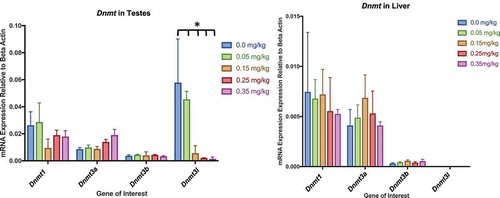
Figure 13. Dnmt Expression in Testes and Liver Assessment of Dnmt1, 3a, 3b, and 3 l by qPCR in testes and liver. (a) Dnmt expression within testes. No significant differences within Dnmt1, Dnmt3a, or Dnmt3b. Dnmt3 l gene expression significantly decreased in response to DAC dose within testes. (b) Dnmt expression in liver had no significant differences between dosing treatments and control. Bars represent the mean and standard deviation from three biological replicates. Single stars indicate p-values<0.05, when compared to controls
Supplemental Material
Download PDF (6.3 MB)Availability
Fastq RNA-seq and WGBS reads are available in the SRA repository. (https://www.ncbi.nlm.nih.gov/sra)