Figures & data
Figure 1. Cross-Tolerance: EHC induces immune tolerance later in life, and reduced expression of IL6 following LPS challenge. (a) Schematic representation of the experiment. EHC on embryonic days (ED) 7–16, followed by BSA/CFA IV–injection on day 14 posthatch. BSA systemic antibody concentration was measured a week later on day 21 poshatch. (b) BSA systemic antibody concentration, CTRL group (nCFA = 9, nBSA = 10, ***P = <0.001); EHC group group (nCFA = 10, nBSA = 10, ***P = <0.001). (c) Experiment scheme, 10-day-old chicks were ICV-injected with LPS (0.3 µg) or saline vehicle (LPS challenge). (d) IL6 mRNA expression was measured in the hypothalamus 6 and 24 hours after LPS challenge, results are presented as fold change relative to HMBS expression and normalized to the average of saline-injected groups. 6 hours (nCTRL = 25, nEHC = 20, **P = 0.009), 24 hours (nCTRL = 15, nEHC = 16, P = 0.23). Data are presented as mean ± SEM, and significant effects between groups are indicated as *0.01 < P < 0.05, **0.001 < P < 0.01, ***P < 0.001 using ANOVA test with LSD for multiple comparisons. CTRL, control
Figure 2. IL6 Intron 1, an Enhancer Suppressed by Methylation, Presents Reduced Demethylation and NFκB Binding in EHC Chicks (a) Schematic representation of IL6 gene. (b) Percentage of methylation (%5mC) in the IL6 promoter, 1st exon (exon 1) and 1st intron (intron 1), n = 5. (c) Percentage of hydroxymethylation (%5hmC) in IL6 promoter exon 1 and intron 1, n = 5. IL6 intron 1 (*P = 0.02). (d) CpG-specific hydroxymethylation of IL6 intron 1. (e) Luciferase assay of IL6 intron 1 inserted into HEK293-HTLR4-MD-CD14 cells (pGL3 + IL6_int1) and normalized to the basic plasmid (pGL3-basic), not containing the insert (n = 8, ***P < 0.0001). (f) ChIP against NFκB on day 10 posthatch before (t0; n = 6) and 6 hours into LPS challenge (n = 6). t0 (***P < 0.0001), LPS challenge (***P < 0.0001). IgG ChIP (n = 3), t0 (P = 0.8), LPS challenge (P = 0.22). Data are presented as mean ± SEM. Significant effect between groups is indicated by *0.01 < P < 0.05, **0.001 < P < 0.01, ***P < 0.001 using ANOVA test with LSD for multiple comparisons. CTRL, control
Figure 3. EZH2 and H3K27me3 both bind to IL6 intron 1 during conditioning, yet only the histone methylation persists later in life. (a) Experimental scheme. Midbrain samples were taken during the embryonic period (embryonic day ED-18) and hypothalamic samples on day 10 posthatch. (b) ChIP against H3K27me3 on ED-18 (n = 6, **P = 0.008); IgG ChIP (n = 4, P = 0.7). (c) ChIP against EZH2 on ED-18 (n = 7, **P = 0.002); IgG ChIP (n = 3, P = 0.38). (d) ChIP against H3K27me2 on ED-18 (n = 6, P = 0.29); IgG ChIP (n = 6, P = 0.89). (e) ChIP against H3K27acetyl on ED-18 (n = 5, P = 0.58); IgG ChIP (n = 4, P = 0.7). (f) ChIP against H3K27me3 on day 10 posthatch (n = 6, *P = 0.02); IgG ChIP (n = 3, P = 0.24). (g) ChIP against EZH2 on day 10 posthatch (n = 6, P = 0.46); IgG ChIP (n = 3, P = 0.28). Data are presented as mean ± SEM. Significant effect between groups is indicated by *0.01 < P < 0.05, **0.001 < P < 0.01, ***P < 0.001. IL6 IL6 intron 1, CTRL, control
Figure 4. EZH2 expression during EHC is regulated by miR26a. (a) Experimental scheme. Midbrain samples were taken during the embryonic period (embryonic day ED-14). (b) EZH2 mRNA expression was measured in the midbrain during ED-14, results are presented as fold change relative to HMBS expression and normalized to the average of CTRL group (nCTRL = 9, nEHC = 10, **P = 0.005). (c) miR26a mRNA expression was measured in the midbrain during ED-14, results are presented as fold change relative to HMBS expression and normalized to the average of CTRL group (nCTRL = 9, nEHC = 10, **P = 0.006). Data are presented as mean ± SEM. Significant effect between groups is indicated by *0.01 < P < 0.05, **0.001 < P < 0.01, ***P < 0.001, CTRL, control
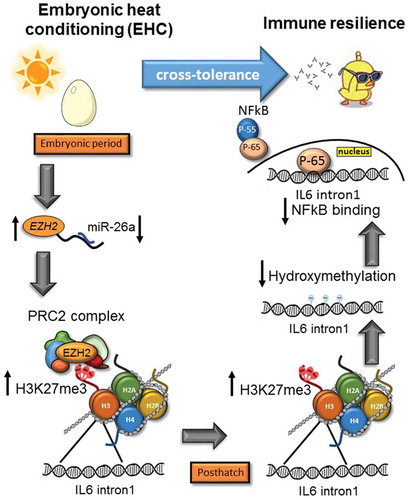
Figure 5. Stress cross-tolerance: EHC induces multi-level, epigenetic mechanisms leading to reduced expression of IL6 and inflammation. From the embryonic period and conditioning to posthatch chick life. During the embryonic period: downregulation of miR-26a and increased EZH2 mRNA expression, followed by increased binding of PRC2 complex and H3K27me3 by EZH2 on IL6 intron1. H3K27me3 persisted to posthatch life, along with reduced IL6 intron1 hydroxymethylation and reduced the NFkB binding to this enhancer. NFkB is presented as two sub-units P55 (regulatory) and P65 (active). In order to activate transcription P65 separates from P55 and moves to the nucleus