Figures & data
Figure 1. A. Volcano plot of associations between EV-microRNA expression and LSCR scores. Estimates from robust linear regression adjusted for infant sex, maternal race, and maternal education. The 8 microRNAs meeting the a priori criteria for significance of p < 0.05 and |Bregression| > 0.2 are plotted in orange. B. Scatter plots of the 8 significant EV-microRNAs and LSCR scores with trend lines from linear models
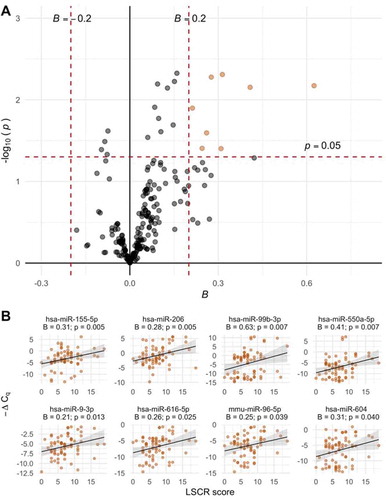
Table 1. Participant characteristics (N = 74)
Table 2. Summary of associations between EV-microRNAs in breast milk and maternal stress variables
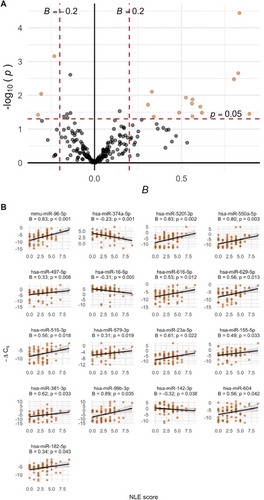
Figure 2. A. Volcano plot of associations between EV-microRNA expression and NLE scores. Estimates from robust linear regression adjusted for infant sex, maternal race, and maternal education. The microRNA meeting the a priori criteria for significance of p < 0.05 and |Bregression| > 0.2 is plotted in orange. B. Scatter plot of the significant EV-microRNA and NLE scores with trend line from linear models