
Figures & data
Figure 1. EWS/FLI colocalization with LSD1 is associated with gene activation. (a) Venn diagram of EWS/FLI and LSD1 peaks as determined by ChIPPeakAnno; CUT&RUN (C&R), p-value calculated by ChIPPeakAnno. B,C) IGB tracks showing coincidence of EWS/FLI (C&R) and LSD1 (C&R) near (b) LMO2 and (c) SALL2. Tracks also show H3K27ac (CUT&Tag [C&T]), H3K4me3 (ChIP-seq), and mRNA (RNA-seq) in the A673 and EFKD conditions. D,E) Genomic distributions of (d) LSD1 peaks (C&R) in A673 cells and (e) EWS/FLI-LSD1 coincident peaks (C&R) that are common across all tested cell lines. F,G) GSEA results using promoter-proximal EWS/FLI-LSD1 coincident peaks (C&R, <5kb to TSS) as the test set (N = 102) and (f) EWS/FLI gene regulation or (g) LSD1 gene regulation as the rank-ordered dataset. NES = normalized enrichment score. |NES|>1.5 is significant. H,I) Profile plots for signal intensity of LSD1 (C&R), EWS/FLI (C&R), and H3K27ac (C&T) within 2 kb of EWS/FLI-LSD1 coincident peaks in either A673 cells or EFKD cells as specified. Profile plots are separated into those proximal to (h) or distal to (i) TSS. See also Supplementary Figure 1–7
![Figure 1. EWS/FLI colocalization with LSD1 is associated with gene activation. (a) Venn diagram of EWS/FLI and LSD1 peaks as determined by ChIPPeakAnno; CUT&RUN (C&R), p-value calculated by ChIPPeakAnno. B,C) IGB tracks showing coincidence of EWS/FLI (C&R) and LSD1 (C&R) near (b) LMO2 and (c) SALL2. Tracks also show H3K27ac (CUT&Tag [C&T]), H3K4me3 (ChIP-seq), and mRNA (RNA-seq) in the A673 and EFKD conditions. D,E) Genomic distributions of (d) LSD1 peaks (C&R) in A673 cells and (e) EWS/FLI-LSD1 coincident peaks (C&R) that are common across all tested cell lines. F,G) GSEA results using promoter-proximal EWS/FLI-LSD1 coincident peaks (C&R, <5kb to TSS) as the test set (N = 102) and (f) EWS/FLI gene regulation or (g) LSD1 gene regulation as the rank-ordered dataset. NES = normalized enrichment score. |NES|>1.5 is significant. H,I) Profile plots for signal intensity of LSD1 (C&R), EWS/FLI (C&R), and H3K27ac (C&T) within 2 kb of EWS/FLI-LSD1 coincident peaks in either A673 cells or EFKD cells as specified. Profile plots are separated into those proximal to (h) or distal to (i) TSS. See also Supplementary Figure 1–7](/cms/asset/79e4da93-dac6-4d73-aacf-9df1c59466ac/kepi_a_1805678_f0001_c.jpg)
Figure 2. LSD1 is enriched at EWS/FLI binding motifs. (a) Profile plots and heatmaps of EWS/FLI (red) and LSD1 (blue) within 3 kb of EWS/FLI peaks. GGAA-microsatellite (µsat) peaks are represented in profile with a blue line and are the top panel in the heatmap. Non-microsatellite (non-µsat) peaks are represented in profile with a green line and are the bottom panel in the heatmap. B) Top ranked result from HOMER de novo motif enrichment analysis with significance value. Analyses in this figure were performed with CUT&RUN data. See also Supplementary Figure 8
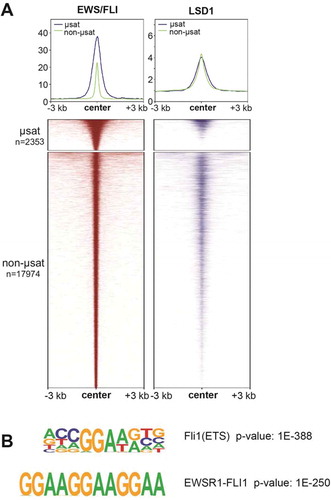
Figure 3. Super-enhancers in A673 cells are associated with both EWS/FLI and LSD1. (a) Pie chart distribution of super-enhancers (SEs) in A673 cells by type of overlapped EWS/FLI-bound motif. (b) Base mean expression for genes associated with super- (N = 615) and typical (N = 6958) enhancers in A673 cells. Mean and SD are shown and p-values were determined using an unpaired t-test. ***p < 0.001. (c) Venn diagram of SEs in A673, EFKD, and wtEF cells as determined by ChIPPeakAnno. (d) Proportions of SEs present in A673 and EFKD cells sorted by the type of EWS/FLI-bound motif overlapped by the SE. (e) EWS/FLI-mediated differential expression for genes associated with SEs in A673 cells sorted by the type of EWS/FLI-bound motif overlapped by the SE. Mean and SD are shown and p-values were determined using one-way ANOVA with multiple comparison testing (***p < 0.001, **p < 0.01, *p < 0.05.) (f) Pie chart distribution of SEs by type of EWS/FLI and LSD1 overlap. g,h) (g) H3K27ac score calculated from the ROSE algorithm and (h) EWS/FLI-mediated differential expression of nearby genes for SEs in A673 cells plotted by type of overlap with EWS/FLI and LSD1. EF-L = EWS/FLI and LSD1 coincident peak, E/F = EWS/FLI only, L = LSD1 only. Mean and SD are shown. N for differential expression and base mean is lower for those K27ac scores because not all genes near SEs were detected by RNA-seq. P-values were determined using one-way ANOVA with multiple comparison testing (***p < 0.001, **p < 0.01, *p < 0.05.) Analyses in this figure were performed with CUT&Tag data and the H3K4me1 ChIP-seq. See also Supplementary Figures 9–11 and Supplementary Tables 1–14
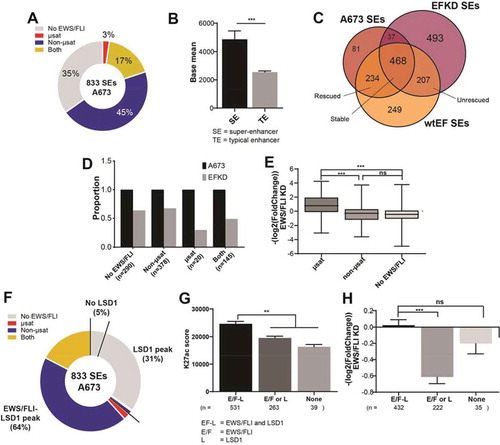
Figure 4. EWS/FLI alters the genome-wide occupancy of LSD1. (a,b) IGB tracks showing EWS/FLI and LSD1 near (a) LMO2 and (b) SERPINE1. Tracks show LSD1 in A673, EFKD, and wtEF cells and mRNA in the A673 and EFKD conditions. (c) Venn diagram of LSD1 peaks in A673, EFKD, and wtEF cells as determined by ChIPPeakAnno. (d) Bar charts showing the dynamics of relative proportions of ‘stable’ LSD1 peaks (detected in A673, EFKD and wtEF). (e) Pie chart distribution showing proportion of EWS/FLI-LSD1 coincident peaks with LSD1 binding dynamics as compared to LSD1 localization in EFKD cells. Analyses in this figure were performed with CUT&Tag data. See also Supplementary Figure 12
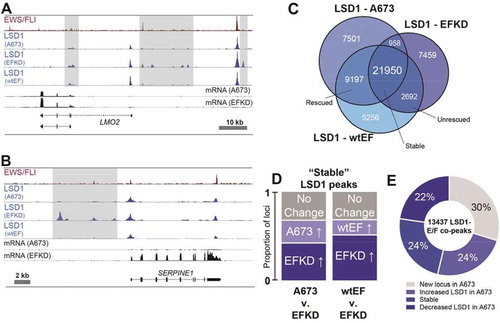
Figure 5. LSD1 binds in super-clusters that are disrupted by EWS/FLI. (a) Venn diagram of LSD1 SCs in A673, EFKD, and wtEF cells b,c) Plotted output of the ROSE analysis for LSD1 superclusters (SCs) in (b) A673 and (c) EFKD cells. (d) IGB tracks showing coincidence of EWS/FLI, LSD1, and H3K27ac in a SE and LSD1 SC near CCND1. Tracks show LSD1 and H3K27ac in A673, EFKD, and wtEF conditions. (e–g) Venn diagrams of SEs and LSD1 SCs in (e) A673 cells, (f) EFKD cells, and (g) wtEF cells. Overlaps and p-values were determined by ChIPPeakAnno. H-J) GSEA results using genes near (h,i) LSD1 SCs in A673 cells (N = 427) or (j) EFKD cells (N = 500) as the test set and either LSD1 gene regulation in A673 cells (h) or EWS/FLI gene regulation (i,j) as the rank-ordered dataset. NES = normalized enrichment score. |NES|>1.5 is significant. (k) Pie chart distribution showing the number of leading edge LSD1 SCs (from j) that collapse in A673 cells. (l) Pie chart distribution showing the overlap of SEs in EFKD cells with different types of LSD1-binding. m,n) (m) H3K27ac score calculated from the ROSE algorithm and (n) EWS/FLI-mediated differential expression of genes near SEs in EFKD cells plotted by type of overlap with LSD1. Mean and SD are shown. N for (N) is lower than (M) because not all genes near SEs were detected by RNA-seq. p-values were determined using one-way ANOVA with multiple comparison testing (***p < 0.001, **p < 0.01, *p < 0.05.) Analyses in this figure were performed with CUT&Tag data and the H3K4me1 ChIP-seq. See also Supplementary Figures 13–14 and Supplementary Tables 2, 4, 6, and 15–20
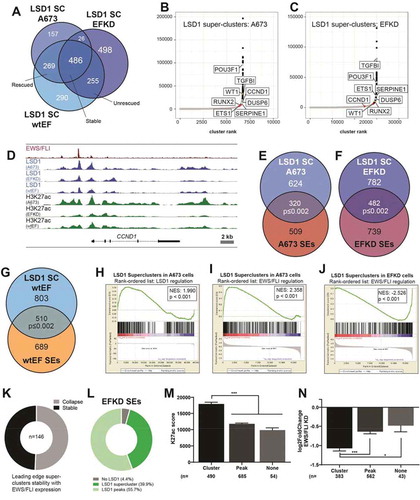
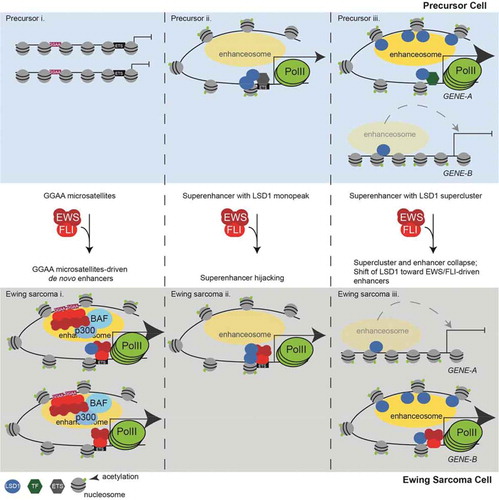
Figure 6. LSD1 is tightly linked to the shifting enhancer landscape in Ewing sarcoma. (a) Model figure showing how EWS/FLI remodels the enhancer landscape and the role of LSD1 in this remodelling. The top panels depict enhancer states found in a precursor cell and the bottom panels represent a Ewing sarcoma cell. Panel (i) shows chromatin remodelling which results in de novo enhancer formation at GGAA-µsats. Panel (ii) shows chromatin remodelling which occurs at enhancers bound by LSD1 with another ETS family member in precursor cells. These enhancers are hijacked by EWS/FLI. Panel (iii) shows supercluster and enhancer collapse which occurs at enhancers with LSD1 superclusters in precursor cells with establishment of an LSD1-decorated supercluster driven by EWS/FLI. The number of PolII molecules by any gene correlates to the level of transcription from those genes
Supplemental Material
Download MS Excel (23.4 MB)Supplemental Material
Download PDF (5.7 MB)Data and pipeline availability
Raw data, bigwigs, and peak calling results are available under the GEO accession: GSE144688
The quality, trimming, and alignment pipelines for single-end ChIP, CUT&RUN, CUT&Tag are available in Singularity containers and can be downloaded from Singularity Hub.
single-end ChIP: shub://ertheisen/southkaibab_centos:hg19v1.centos
CUT&RUN and CUT&Tag: shub://ertheisen/hohriver_centos:hg19v2.centos
Alternatively, the recipe files are available at https://github.com/ertheisen?tab=repositories.