
Figures & data
Figure 1. Comparison of ICC values for raw and preprocessed data. Shown are the ICCs calculated based on the 128 technical replicates with 450 K methylation data. Data preprocessing steps include either ENmix background correction, RELIC dye-bias correction, quantile normalization and RCP probe type bias correction (ENmix+RCP) or noob background correction, Illumina dye-bias correction, quantile normalization and BMIQ probe type bias correction (noob+BMIQ). The x-axis labels are the ICC median of each bin
Figure 2. Correlation between ICC and methylation mean or methylation variation. ICC was calculated based on the 128 replicates with 450 K array data for 469,291 CpGs. Methylation standard deviation or mean for each CpG was calculated in 2878 Sister Study samples. Boxplots represent distribution of CpGs by (a) methylation level (beta value) and (b) by methylation SD. The bars represent medians, boxes represent first and third quartiles, whiskers 1.5 inter-quantile range (IQR), and circles are outliers
Figure 3. ICC comparisons between array platforms and between different studies. A) Comparison of between- and within-array ICC values for the 25,948 CpGs shared between the Illumina 27 K and 450 K arrays. Within-array ICC plotted on the Y-axis was calculated based on results from 128 duplicates run on 450 K arrays. Between-platform ICC plotted on the X-axis was calculated based on results from 476 Sister Study samples that were assayed on both 27 K and 450 K arrays. B) Comparison of ICC values for CpGs estimated in different studies using 450 K arrays: Sister Study ICC calculated using 128 duplicates from women with an average age of 58 years. The NCL study ICC was calculated using 20 duplicates from newborns, 13 males and 7 females
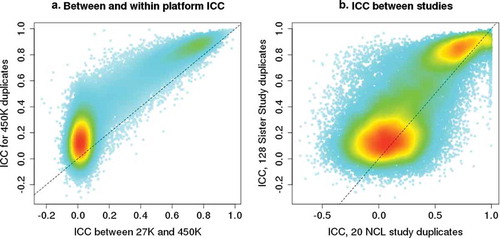
Figure 4. Distribution of all probes on 450 K array compared to CpGs reported as statistically significant in the EWAS Atlas of 570 studies (115,888 CpGs at threshold of p < 10−5 or 74,411 CpGs at threshold of p < 10−[Citation8]). A) Distributions by ICC values. B) Distributions by methylation (beta) values
![Figure 4. Distribution of all probes on 450 K array compared to CpGs reported as statistically significant in the EWAS Atlas of 570 studies (115,888 CpGs at threshold of p < 10−5 or 74,411 CpGs at threshold of p < 10−[Citation8]). A) Distributions by ICC values. B) Distributions by methylation (beta) values](/cms/asset/a82a171f-6b6c-4046-b71f-456b8c15cc26/kepi_a_1805692_f0004_b.gif)