
Figures & data
Table 1. Covariates for the URECA children in our study, stratified by self-reported race
Figure 1. Estimated ancestry principal components (PCs) 1 and 2. Nearly all the variation in ancestry separates along PC1 in the URECA sample. Filled triangles represent the 196 URECA children in this study, with their self-reported race shown in different colours. Open circles are reference control samples from HapMap; red = Utah residents from northern and western Europe (CEU); yellow = east Asian (Chinese and Japanese); dark blue = Africans from Nigeria (Yoruban)
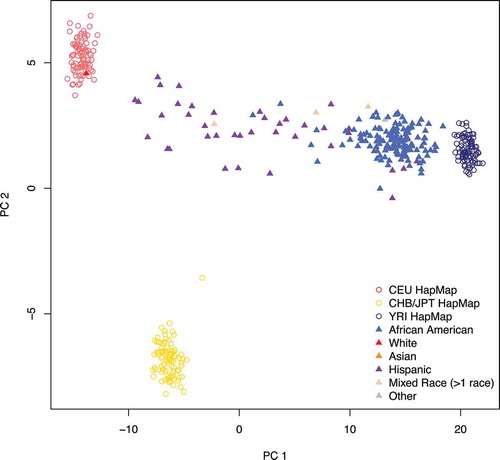
Figure 2. Overlapping ancestry CpGs at birth and at age 7. (a): self-reported race-associated CpGs (RR-CpGs) with (violet) or
(red or blue). A discordant RR-CpG was classified as significant at birth but not at age 7 (blue) if the marginal posterior probability that the effect was non-zero at birth was greater than that at age 7. Discordant RR-CpGs that were significant at age 7 but not at birth (red) were defined analogously. (b): The same as (a), but for inferred genetic ancestry-associated CpGs (IGA-CpGs). (c): The overlap between RR-CpGs (
or
) and IGA-CpGs (
or
)
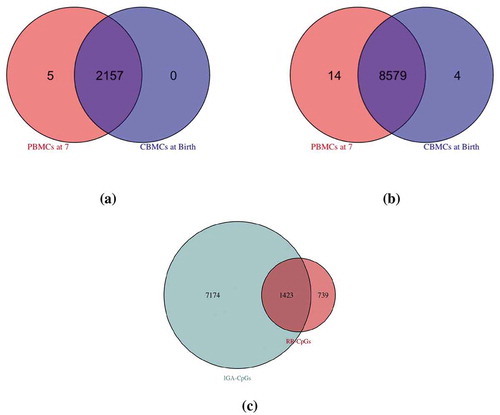
Figure 3. RR-CpGs are enriched for CpGs with meQTLs. (a) Illustration of the causal relationship between the DNAm (m) at a CpG site, the genotype (g) at the SNP within kb of the CpG that had the smallest meQTL P value and self-reported race (RR). Each graph corresponds to a unique CpG. (b) Plots of the meQTL P value for edge
in CBMCs at birth, where CpGs were stratified by whether or not it was an RR-CpG (
or
). The ten enlarged red circles are just for visual aid
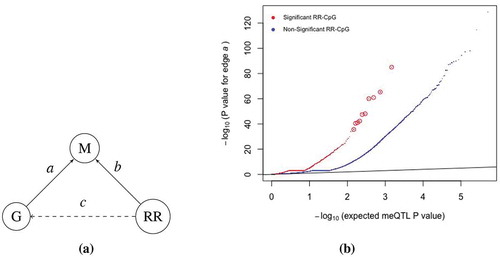
Figure 4. meQTL P value enrichment, where circled blue points are for visual aid (left), and the relative proportion of variance in DNAm levels explained by genotype (right). The x-axis of the latter was defined as the ratio of the proportion of variance in DNAm levels explained by the genotype of each CpG’s closest SNP to the sum of the aforementioned genetic proportion and the proportion explained by maternal cotinine levels during pregnancy. A ratio indicates that local genotype explained more variance than maternal cotinine levels during pregnancy
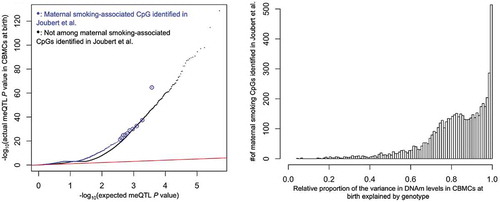
Table 2. Sample size and composition for each analysis