
Figures & data
Figure 1. Flowchart of analytical procedures for selecting CpG sites in the peripheral blood methylome, machine learning prediction models to predict high and low mortality risk groups, survival analysis, Gene Ontology enrichment analysis, and epigenome-wide association analysis
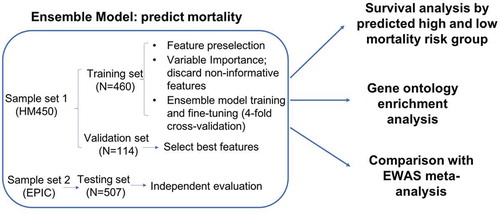
Table 1. Study sample characteristics
Figure 2. Variable importance ranking of predictive machine learning CpG sites. Variable importance is a score between 0 and 100, as calculated by elastic-net-regularized generalized linear models (GLMNET). We obtained variable importance scores from 100 bootstraps. The top 20 ranked CpG sites and 20 bootstraps are shown
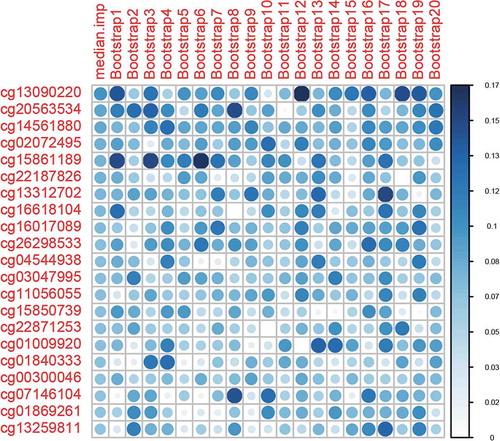
Figure 3. Area under the receiver operating characteristic (auROC) curve in the training and validation sets
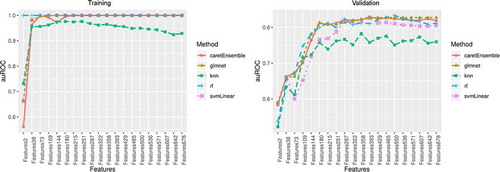
Figure 4. Area under the precision-recall curve (auPRC) in the training and validation sets
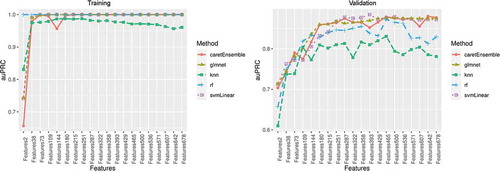
Figure 5. Receiver operating characteristic (auROC) curve in the testing set
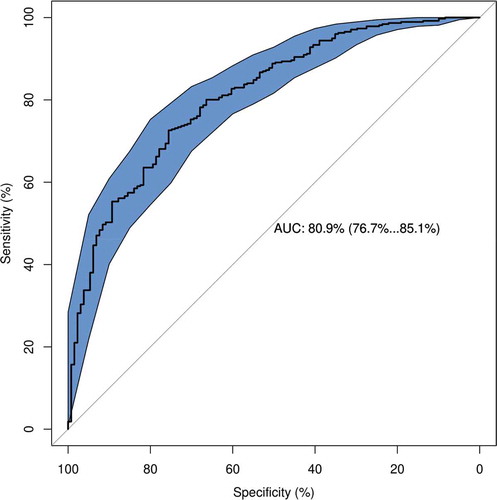
Figure 6. Kaplan-Meier curves of predicted high and low mortality risk groups among people living with HIV
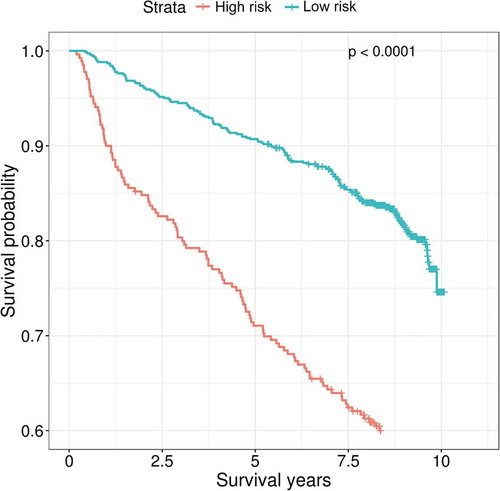
Table 2. Gene ontology term enrichment analysis of the selected 393 CpG sites that predict mortality risk among HIV-positive population
Table 3. Overlapping CpG sites between machine learning selected CpG sites and epigenome-wide significant CpG sites on mortality risk among people living with HIV