
Figures & data
Figure 1. Illustrative example of quality control metric evolution over time for one donor, two tubes and three time points (left) and corresponding boxplot of the fold changes per tube (right). T0 = plasma prepared immediately after blood draw, T24 = plasma prepared 24 hours after blood draw, T72 = plasma prepared 72 hours after blood draw. The white triangle on the boxplot corresponds to the mean
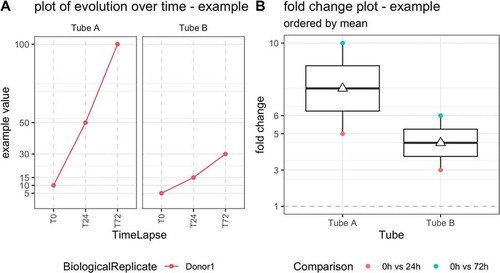
Figure 2. Capillary electropherograms (Femto PULSE) of all 15 cfDNA samples obtained from donor 2. RFU = relative fluorescence units. T0 = plasma prepared immediately after blood draw, T24 = plasma prepared 24 hours after blood draw, T72 = plasma prepared 72 hours after blood draw. Peaks at 1 and 6000 bp correspond to the lower marker (1 bp) and upper marker (6000 bp)
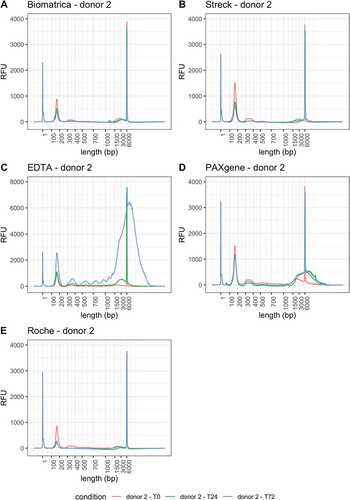
Figure 3. (a) Evolution of cfDNA concentration calculated based lambda DNA spike-in after DNA isolation and before library construction, (b) Boxplot of fold changes within each donor across timepoints per tube for cfDNA concentration. (c) Evolution of the genome-wide CpG methylation percentage, split per tube, (d) Boxplot of the absolute change within each donor across timepoints per tube for the genome-wide CpG methylation percentage. (e) Evolution of the absolute number of CpGs detected before setting a read count cut-off, split per tube, (f) Boxplot of the fold change within each donor across timepoints per tube absolute number of CpGs detected. (G and H) Evolution and boxplot of fold change of absolute number of CpGs detected after setting a read count cut-off of 15 reads. (I and J) Evolution of natural killer cell contribution, split per tube, calculated with NNLS using human methylation 450 K and EPIC micro-array data as reference dataset or with CelFiE, using public whole genome bisulphite sequencing data from ENCODE/BLUEPRINT as reference set. (K and L) Boxplot of absolute changes in NK cell fractions within each donor across timepoints per tube. The white triangle on the boxplot corresponds to the mean of the absolute change. NK, natural killer cell. T0 = plasma prepared immediately after blood draw, T24 = plasma prepared 24 hours after blood draw, T72 = plasma prepared 72 hours after blood draw
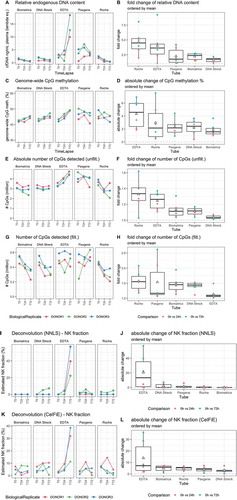
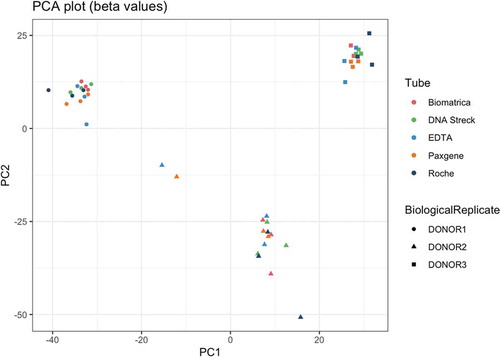
Figure 4. Principal component analysis performed on the beta values (fraction of methylated reads), with common cytosines in a CpG context across all samples (at least 15 reads per cytosine, n = 6706)
Supplemental Material
Download Zip (3.9 MB)Data availability
Scripts, supporting files and full data analysis is available at https://github.com/rmvpaeme/cfRRBS_tube_study.
Raw data is available at EGA identifier EGAD00001006007. Processed data can be found at ArrayExpress identifier E-MTAB-8858.
The cf-RRBS protocol is available at https://www.protocols.io/private/4098389D37C151C92AA19EC574AD9201.