Figures & data
Figure 1. The schematic diagram of the data analysis
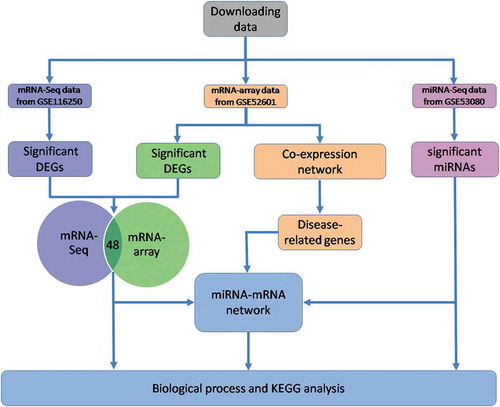
Figure 2. mRNA-Seq analysis for DEGs. (a) Principal component analysis of all three groups such as ICM (red), DCM (green), and NF (blue). (b) Box and violin plot depicts gene expression of each sample. (c) Heat map matrix shows the significantly differential expression levels of DEGs in samples. (d) Volcano plot of ICM-NF. (e) Volcano plot of DCM-NF. Plots in grey represent genes that are not significant. Plots in green represent genes with log2 FC>1. Plots in blue represent genes with P < 0.05, and plots in red represent genes with log2 FC>1 and P < 0.05. (f) Venn diagrams of significant DEGs detected in ICM-NF and DCM-NF
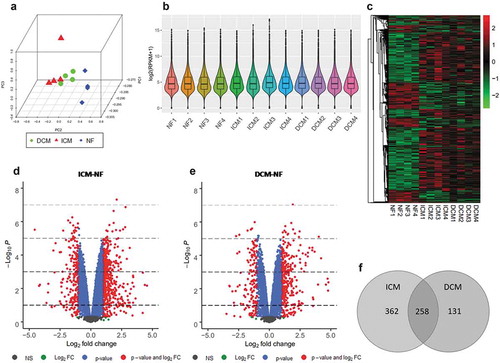
Figure 3. Identification of disease-related genes using WGCNA analysis. (a) Cluster dendrogram plots. (b) The module-trait relationships plot describes the correlations between module genes and clinical phenotype. The positive correlation between module and trait (red); the negative correlation (blue); the no significant correlation (white); the higher the correlation (darker). NYHA: New York Heart Association. (c) Correlation dot plots depict the correlation coefficient and P between module and disease. The dot plot of red module clusters with a line revealing the high and positive correlation with disease. (d) Heat map and bar plot of red module. Each row of heat map represents a gene and each column represents a sample. Each column of bar plot delegates a sample corresponding to the column of heat map, the height of bars delegates the gene expression
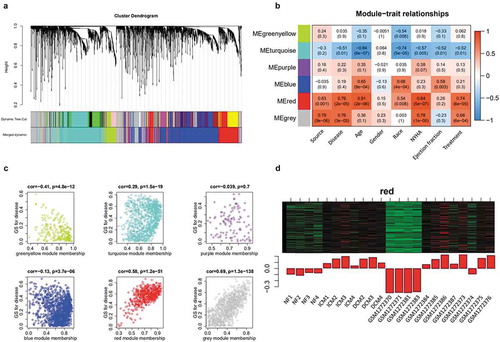
Figure 4. Overview of microarray analysis for DEGs. (a) Principal component analysis of all three groups, ICM (red), DCM (green), and NF (blue). (b) Box and violin plot depicts gene expression of each sample. (c) Heat map matrix shows the significantly differential expression levels of DEGs in samples. Each row represents a gene and each column represents a sample. Low-expressed genes that below the median (green); high expressed genes that above the median (red). The colour saturation indicated the magnitude of deviation from the median. (d) Volcano plot of ICM-NF. (e) Volcano plot of DCM-NF. Plots in grey represent genes that are not significant. Plots in blue represent genes with P < 0.05, and plots in red represent genes with log2FC>1 and P < 0.05. (f) Venn diagrams of significant DEGs detected in ICM-NF and DCM-NF. Overlapping genes are differentially expressed in both ICM and DCM groups
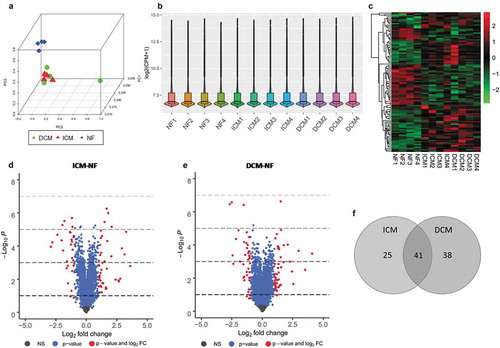
Table 1. Significantly differential expressed key genes in red module
Table 2. Overlapping DEGs
Figure 5. Identification and KEGG analysis of overlapping DEGs. (a) Venn diagrams of significant DEGs detected with microarray and RNA-Seq. Overlapping genes were considered as reliable DEGs and used in this analysis. (b) Circle graph of biological process analysis of overlapping DEGs. Different coloured blocks represent different biological processes. Several important biological processes are shown below the circle diagram. (c) Bubble plot of KEGG pathway enrichment analysis results of overlapping DEGs. All pathways are identified with P cut-off value of 0.05
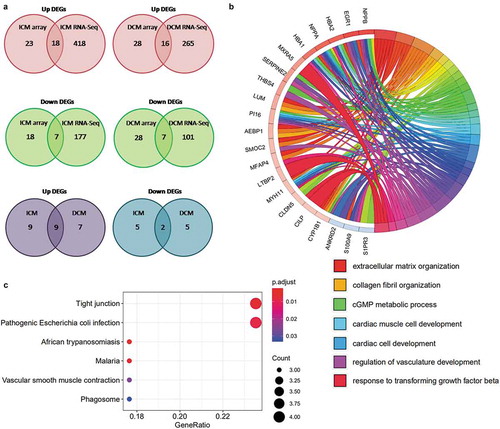
Figure 6. Overview of miRNA-Seq analysis for significantly differential expressed miRNAs. (a) Principal component analysis of all three groups, ICM (red), DCM (green), and NF (blue). (b) Box and violin plot depicts miRNAs expression of each sample in terms of log2 (CPM+1). (c) Heat map matrix shows the significantly differential expression levels of miRNAs in samples. (d) Volcano plot of ICM-NF. (e) Volcano plot of DCM-NF. Plots in grey represent miRNAs that are not significant. Plots in blue represent miRNAs with P < 0.05, and plots in red represent miRNAs with log2 FC>1 and P < 0.05. (f) Venn diagrams of significantly differentially expressed miRNAs detected in ICM-NF and DCM-NF. (g) Pathway analysis of significantly differential expressed miRNAs in ICM-NF. (h) Pathway analysis of significantly differential expressed miRNAs in DCM-NF. Gene number depicts the quantity of miRNAs in each pathway
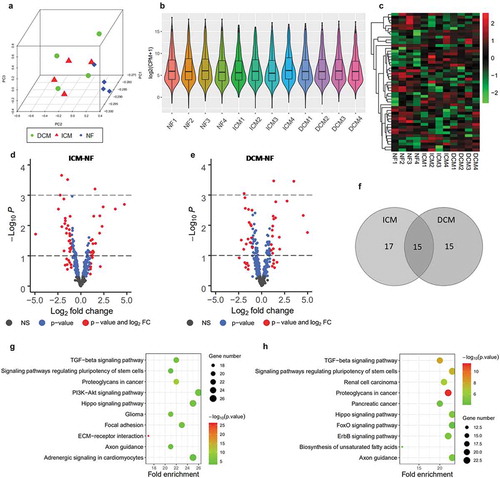
Table 3. Negatively correlated miRNA–mRNA
Figure 7. Identification of miRNA-mRNA network. (a) All related miRNA-mRNA network. (b) Network of miRNA-mRNA that confirmed with negative correlations in fold change. miRNAs (blue), up-regulated target mRNAs (red), and down-regulated target mRNAs (green). (c) Pathway analysis of target genes of miR-542-3p and miR-542-5p. All pathways are identified with P cut-off value of 0.05. Gene number depicts the quantity of target genes of miRNAs enriched in each pathway
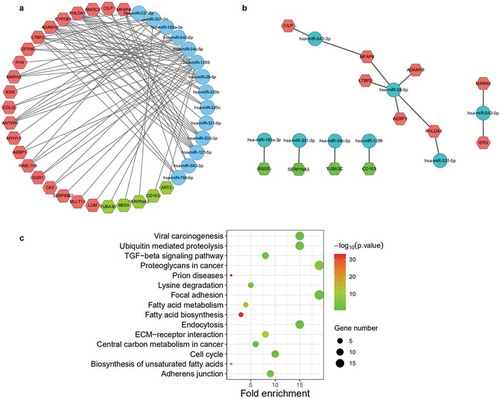
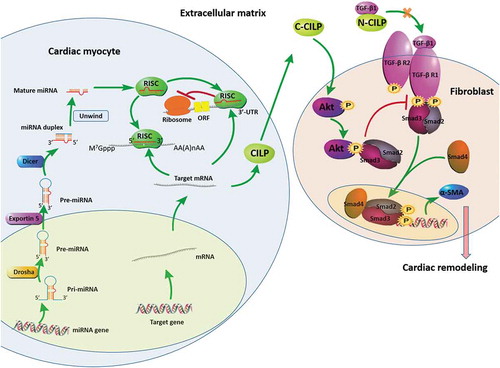
Figure 8. Molecular and subcellular events leading to cardiac remodelling. Drosha: RNase III enzymes; Exportin 5: nuclear export protein; Dicer: RNase III enzymes; RISC: RNA-induced silencing complexes; CILP: cartilage intermediate layer protein; C-CILP: the C-terminal of CILP; N-CILP: the N-terminal of CILP; α-SMA: α-smooth muscle actin. The downregulation of miR-542-3p promotes the expression of CILP. The C-terminal of CILP (C-CILP) increases Akt phosphorylation and promotes the interaction between Akt and Smad3. The N-terminal of CILP (N-CILP) combines with TGF-β1. These different ways jointly inhibit Smad3 signalling activation in TGF-β signalling pathway, suppress the expression of α-SMA, and protect the heart from cardiac remodelling