Figures & data
Figure 1. The distribution of carbohydrate-deficient transferrin (CDT, expressed as %) levels for HAC cases and controls
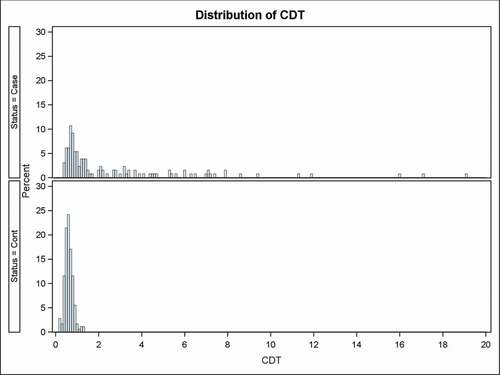
Figure 2. The distribution of ATS levels for HAC cases and controls
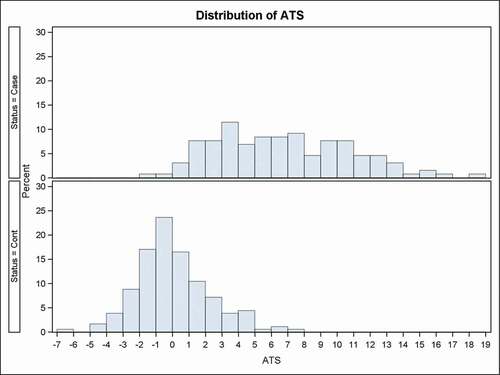
Table 1. Characteristics of study participants
Table 2. CDT and ATS comparison by sex for HAC cases and controls
Table 3. AUC and AIC for Logistic Regression of CDT and ATS Values for Predicting HAC
Figure 3. Receiver Operator Characteristic Curve (ROC) for CDT
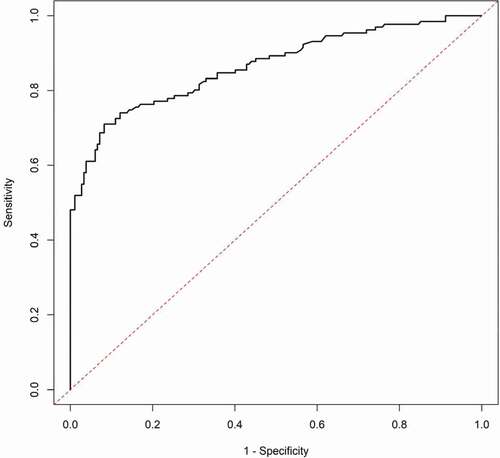
Figure 4. Receiver Operator Characteristic Curve (ROC) for ATS
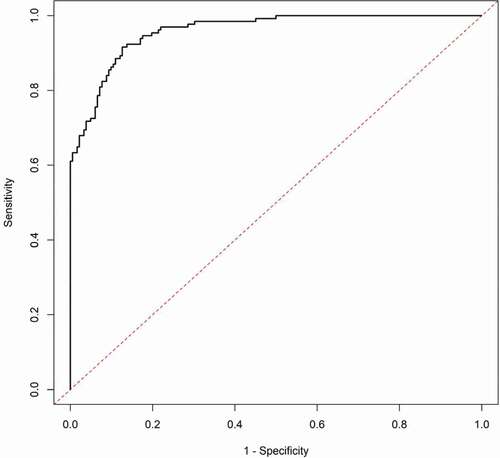
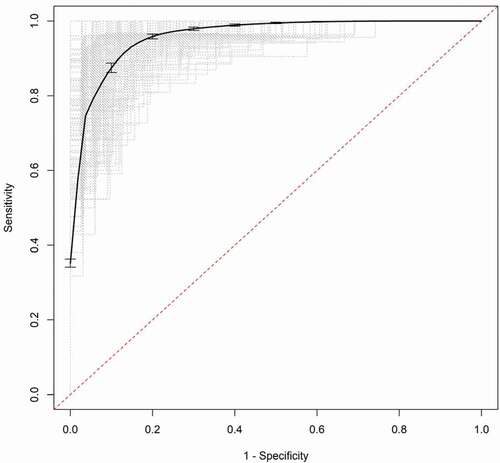
Figure 5. Aggregated receiver operator characteristic curve (ROC) for CDT. The dotted grey lines are the ROC curves for the bootstrap samples and the solid black line is the aggregated ROC curve
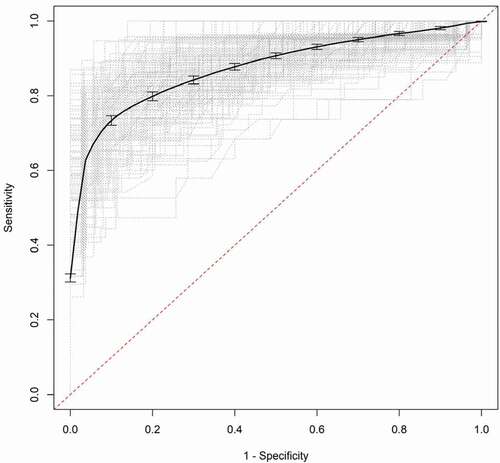
Figure 6. Aggregated receiver operator characteristic curve (ROC) for ATS. The dotted grey lines are the ROC curves for the bootstrap samples and the solid black line is the aggregated ROC curve