
Figures & data
Figure 1. Effects of HIV-1 Tat and cocaine on DNMT and TET protein levels in human primary astrocytes. Human primary astrocytes (1x10⁶ cells/ml) were treated with HIV-1 Tat (100 ng), cocaine (0.5 µM) or a combination of HIV-1 Tat and cocaine for 24 hr. Total cell lysates were resolved by SDS-PAGE and analysed by western blotting for DNMT1 (a), DNMT3a (b), DNMT3b (c), TET-1 (d), TET-2 (e), TET-3 (f) and total protein GAPDH. (g), (h), (i), (j), (k) and (l) show the densitometric values for DNMT1, DNMT3a, DNMT3b, TET1, TET2 and TET3 protein levels (fold change compared to the control), respectively. The data are expressed as the mean ± SE of three independent experiments. ****P < 0.0001, ***P < 0.001, **P < 0.01, *P < 0.05, NS – Nonsignificant
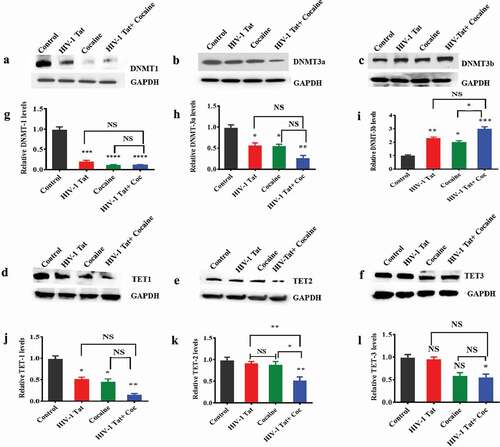
Figure 2. HIV-1 Tat and cocaine affect global DNA methylation (5mC) content and DNMT enzyme activity in human primary astrocytes. Total cellular DNA and nuclear extracts were obtained from human primary astrocytes treated with HIV-Tat alone, cocaine alone, or HIV-1 Tat and cocaine for 24 hr. DNA was isolated, and equal amounts were used to determine the overall DNMT activity (a) and global DNA methylation (5mC) by ELISA (b). The data are expressed as fold changes compared to the control level ± SE for 3 independent experiments. ***P < 0.001, **P < 0.01, *P < 0.05, NS – Nonsignificant
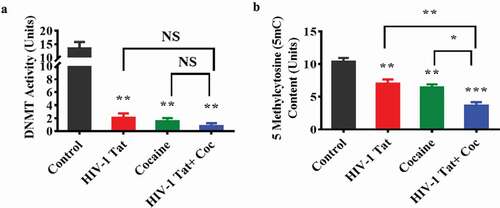
Figure 3. Effects of HIV-1 Tat and cocaine on DNMTs and TET proteins. HIV-1 inducible Tat transgenic (iTat) or saline-treated (control) mice received daily intraperitoneal injections of saline or Dox (100 mg/kg/d) over 14 days either with or without s.c. cocaine (10 mg/kg/d). Following treatment, equal amounts of protein lysates from harvested brains were resolved, and we analysed protein expression using western blot analysis. The results show the levels of DNMT1 (a), DNMT3a (b), DNMT3b (c), TET1 (d), TET2 (e) and TET3 (f) in HIV-Tat (GT-tg) mouse brains and the levels of total GAPDH protein. (g), (h), (i), (j), (k) and (l) show the densitometric values for DNMT1, DNMT3a, DNMT3b, TET1, TET2 and TET3 protein levels (fold change compared to the control), respectively. The data are expressed as the mean ± SE of three independent experiments. The data represent 3 independent experiments. ****P < 0.0001, ***P < 0.001, **P < 0.01, *P < 0.05, NS – Nonsignificant
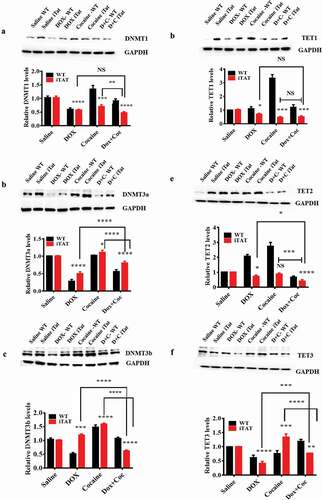
Figure 4. Effects of HIV-1 Tat and cocaine on in vitro and in vivo mtDNMTs. For the in vitro experiment, human primary astrocytes (3 × 10⁸ cells/ml) were treated with HIV-Tat (100 ng) or cocaine (0.5 µM) for 24 hr. For the in vivo experiment, HIV-1 inducible Tat transgenic (iTat) or saline-treated (control) mice received daily intraperitoneal injections of saline or Dox (100 mg/kg/d) over 14 days either with or without s.c. cocaine (10 mg/kg/d). At the end of the experiment, mitochondria were isolated from human primary astrocytes and HIV-1 iTat mice, and equal amounts of mitochondrial fraction were resolved by SDS-PAGE and analysed by western blot analysis. DNMT1 (a), DNMT3a (b) and DNMT3b (c) levels in human primary astrocytes; DNMT1 (f), DNMT3a (g) and DNMT3b (h) levels in HIV-iTat mouse brains; and total protein VDAC levels were analysed in vitro (d) and in vivo (i). (e) shows the densitometric values for DNMT1, DNMT3a, and DNMT3b protein levels (fold change compared to the control) in human primary astrocyte mitochondrial fractions in vitro, and (j) shows the densitometric values for DNMT1, DNMT3a, and DNMT3b protein levels (fold change compared to the control) in mouse brain mitochondrial fractions in vivo. The data represent 3 independent experiments. ****P < 0.0001, ***P < 0.001, **P < 0.01, *P < 0.05, NS – Nonsignificant
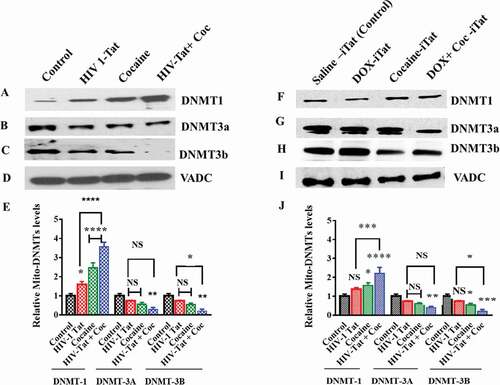
Figure 5. Impacts of HIV-1 Tat and cocaine on mtDNA methylation, as analysed by pyrosequencing. mtDNA methylation profiles were determined by pyrosequencing in order to compare the levels of methylation among primary astrocytes treated with HIV-1 Tat/cocaine. The levels of methylation (% methylation) at CpG sites across the A) MT-CYB and MT-RNR1 and B) MT-ND1 and D-loop regions are shown. All of the values are expressed as the mean±SD of each group. The data represent 3 independent experiments. *P < 0.05
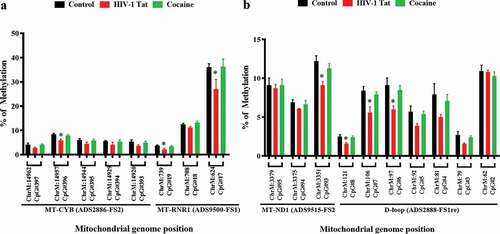
Figure 6. Mitochondrial methylation is shown with reference to the human mitochondrial genome. A) Sixty-four bisulphite PCR primers were designed using Qiagen ADSW to investigate 326 CpG sites in the mitochondrial genome. mtDNA methylation was analysed by TNGBS of the mitochondrial genome in primary astrocytes. B) The mtDNA methylation shown at different CpG sites is representative of three independent experiments, and the results were aligned to the human mitochondrial genome (NCBI reference sequence: NC_012920.1, length: 16,569 bp). *P < 0.05
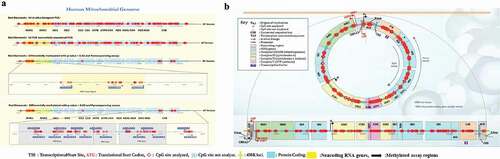
Figure 7. Summary statistics of the percentages of mitochondrial methylation in CpG and non-CpG sites in primary astrocytes. The mtDNA methylation (methylation %) patterns in primary astrocytes differed among the control (a), HIV-1 Tat (b) and cocaine (c) groups. The data represent 3 independent experiments
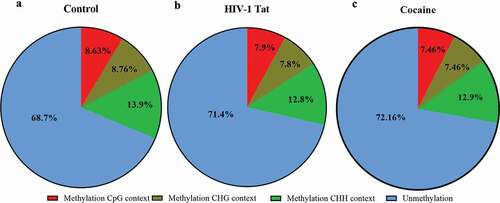
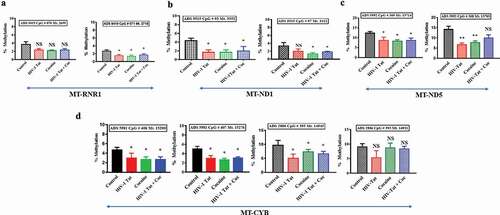
Figure 8. Impacts of HIV-1 Tat and cocaine on mtDNA methylation, as analysed by TNGBS. The mtDNA methylation profiles were determined by mitochondrial genome bisulphite sequencing to compare the levels of methylation among primary astrocytes treated with HIV-1 Tat/cocaine. The levels of methylation (% methylation) at CpG sites across the A) RNR1 gene B) ND1 gene C) ND5 gene D) CYB genes are shown. All of the values are expressed as the mean±SD of each group. The data represent 3 independent experiments. **P < 0.01, *P < 0.05, NS – Nonsignificant
Data availability
The authors confirm that the data supporting the findings of this study are available within the article and/or its supplementary materials.