
Figures & data
Figure 1. Identification of non-templated additions (NTAs) of miRNAs
(A) miNTA, a bioinformatic pipeline to identify miRNA NTAs. Small RNA-seq reads were mapped to hg19 allowing up to one mismatch and retaining uniquely mapped reads only. An iterative mapping approach was applied to unmapped reads by sequentially trimming 1 nucleotide on the 3’ and 5’ ends before remapping. Each end was trimmed twice. All mapped reads were examined relative to the human genome reference to identify 3’ and 5’ NTAs. After annotating mapped reads to novel and known miRNAs, reads were passed through several quality control (QC) filters to remove likely false positives from mapping and sequencing errors. See Materials and Methods for more details. (B) Percentage of miRNA reads with 3’ end non-templated mono-uridylation (U), adenylation (A), guanidylation (G) and cytidylation (C) identified by miNTA using small RNA-seq data derived from control (shControl) and TUT4/7 double KD HEK293 cells.
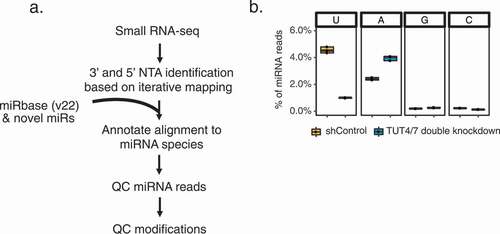
Figure 2. Generation of a comprehensive catalogue of extracellular miRNAs
(A) Extracellular and intracellular small RNA-seq datasets used in this study. (B) Number of known and novel miRNAs observed in greater than N samples (x axis) across all data sets in (A). (C) Empirical cumulative distribution function (eCDF) of the abundance of known or novel miRNAs in all data sets in (A). Normalized read counts were calculated using DESeq2 (Methods). P value was calculated via a two-sided Kolmogorov–Smirnov (KS) test. (D) Expression of a novel miRNA (chr7_40460) in whole-cell lysates (Cell), non-vesicle extracellular (NV) and small extracellular vesicle (Small EV) fractions isolated from Gli36 cells.
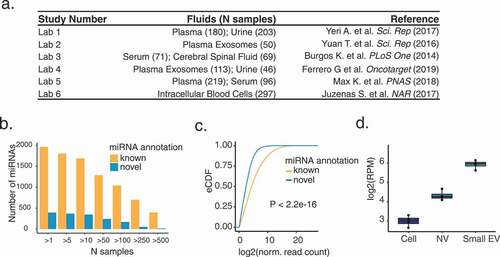
Figure 3. NTA profiles of extracellular miRNAs across biofluids
(A) Percentage of miRNA reads with 3’ (left) and 5’ (right) NTAs across all samples in each data set. (B) Nucleotide composition of 3’ NTAs in miRNA reads across all samples in each data set. (C) Average percentage of reads with 3’ uridylation or adenylation among all miRNA reads with 3’ NTAs. Each dot represents this average value for an extracellular fluid type or intracellular cell type in each study. P values were calculated via Wilcoxon rank-sum test.
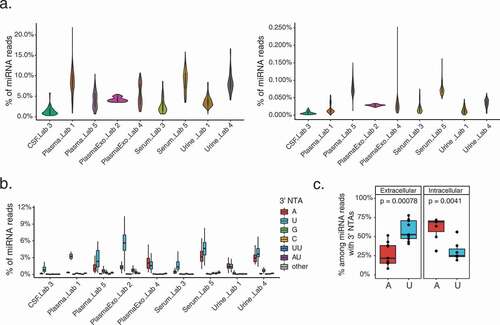
Figure 4. Characteristics of miRNAs with 3’ NTAs
(A) 3’ uridylation levels of miRNA species in each data set. Blue curves represent the average 3’ NTA levels and grey shades represent standard errors. The horizontal dashed green and blue lines represent 10% and 20% 3’ U thresholds, respectively. Shaded green and blue regions encompass miRNAs with 3’ U levels between 10% – 20% and >20%, respectively, with the percentage of such miRNAs among all 3’ U modified miRNAs shown. The miRNA hsa-let-7 f-2-3p is highlighted as a red dot. (B) Similar to (A) but for miRNA 3’ adenylation levels. The miRNA hsa-miR-6513-3p is highlighted as a red dot. (C) Gene ontology terms enriched among miRNAs with an average 3’ uridylation level ≥5% (FDR < 0.05, Methods). The size of the dots reflects the number of miRNAs in each GO term. (D) Similar to (C) but for miRNA 3’ adenylation.
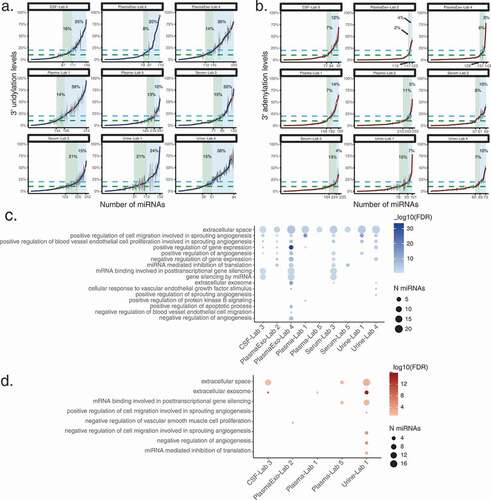
Figure 5. Distinct miRNA 3’ uridylation profiles across fluids
(A) tSNE clustering of samples using miRNA 3’ uridylation levels. miRNAs expressed with a minimum read count of 10 were included for this analysis. (B-D) Example miRNAs observed with differential 3’ uridylation levels between fluids of the same study. P values were calculated via REDITs (Methods).
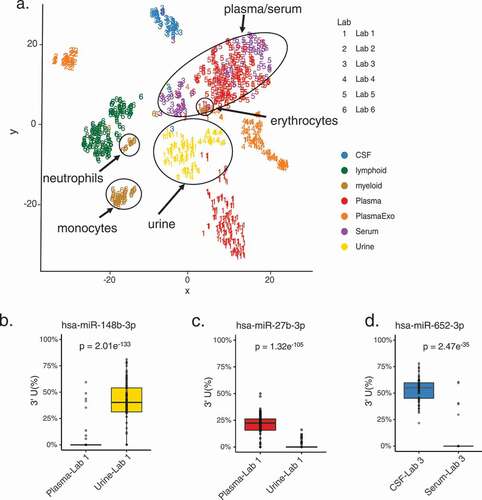
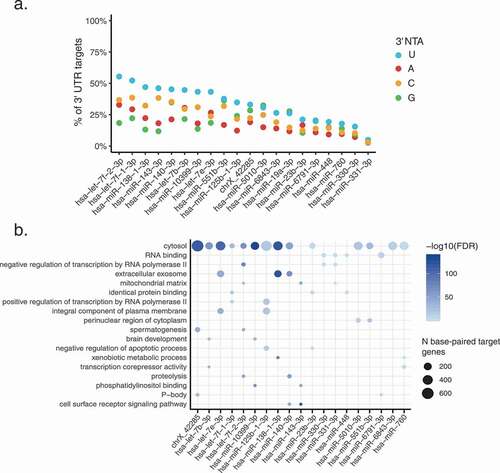
Figure 6. 3’ U base-pairs with predicted miRNA targets more often than other 3’ NTAs
(A) Percentage of predicted miRNA 3’ UTR targets that base-pair with 3’ U (or A, C, G) for the top 20 unique miRNAs with highest average 3’ uridylation levels (per fluid) across all samples (Methods). For all miRNAs, the number of 3’ Us base-paired with predicted miRNA targets is higher than at least one background nucleotide (A, C or G) (Chi-squared test p < 0.05). (B) For each miRNA, the top 5 enriched GO terms among its target genes that base-paired with the 3’ U were collected (Methods). Enriched terms observed in at least two data sets are shown (FDR < 0.05). The size of the dots represents the number (N) of base-paired target genes.
Supplemental material