
Figures & data
Table 1. Localization and clinical diagnosis by p16 VPH groups
Figure 1. Forest plot of study design
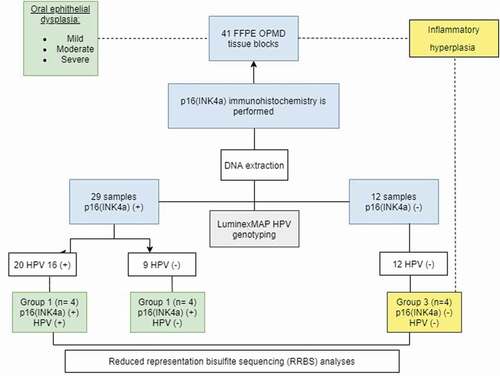
Figure 2. p16INK4a staining. Positive IHC pattern for p16INK4a expression obtained in the samples diagnosed with epithelial dysplasia HPV (+). (400x). Figures (a), (b) and (c) can be described, using Kospokolou 2011 patterns, as patchy positivity patterns and figure (d) as a focal positivity pattern
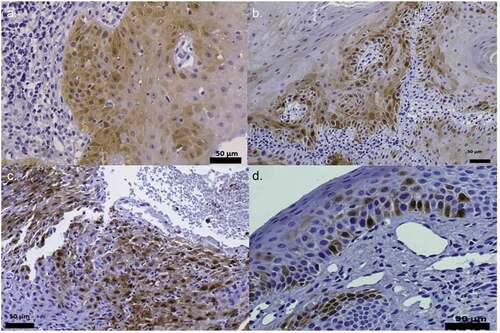
Table 2. p16INK4a expression by HPV groups
Figure 3. Genome-wide DNA-methylation changes in hyperplasia, OPMD HPV+ and HPV- samples (a) Hierarchical clustering and heatmap of DMRs defined by difference ≥15%, false discovery rate (FDR)-adjusted q-value ≤ 0.05 and read coverage ≥10 in OPMD tissues. The colour indicates the percentage of methylation: hyper (in red) and hypo (in green). Heat maps for tissues were generated by complete linkage clustering using a Pearson correlation. (b) Violin plot showing the median methylation level (horizontal line) and distribution patterns (density and IQR) of the identified DMRs in hyperplasia, OPMD HPV+ and HPV- samples (c) Principal component analysis (PCA) of DNA-methylation changes demonstrates a clear separation of HPV-p16m- samples (hyperplasias) (blue) and dysplasia samples (green and red) (d) DNA sequences motifs identified to be enriched in DMRs by MEME suite software. The right column contains the transcription factor similar to these motifs using JASPAR database and p value
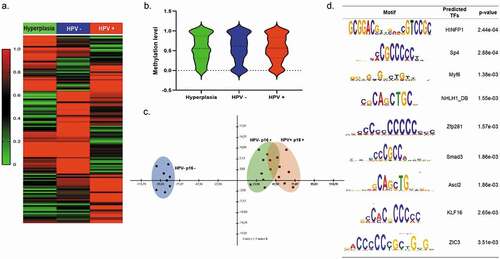
Figure 4. DNA-methylation patterns were identified by RRBS analysis in OPMD samples (a) Interactome integrated network analysis of DMRs involved in OPMD HPV+ and HPV – (b) Gene ontology (GO) analysis of DMRs in OPMD samples. The GO terms were clustered into biological processes (BP), molecular function (MF) and cellular component (CC). (c). Enriched reactome pathways for DMRs in OPMD tissues involved in immune system regulation
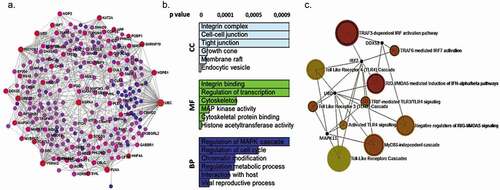
Figure 5. DNA-methylation patterns were identified by RRBS analysis in OPMD samples (a) Heat maps of DMRs in OPMD HPV+ and HPV – tissues. (b). Enriched reactome genes for DMRs in OPMD tissues involved in immune system regulation
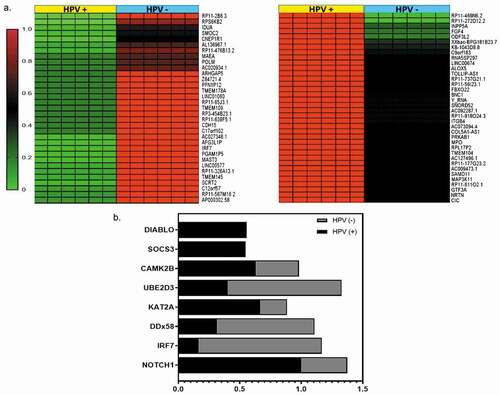
Figure 6. Distribution of Methylated Regions (MRs) annotated to specific genomic regions. (a). Peak and gene associations obtained by analysing the annotations of nearby genes and regulatory elements wherein genomic distances are divided into bins relative to transcription start site (TSS) as [0, 5 kb], [5 kb, 50 kb], [50 kb, 500 kb], [500 kb, infinity]. Values on the Y-axis represent per cent of peaks found in a given genomic region (b). Genic annotations of DMRs include 1–5Kb upstream of the TSS, the promoter (< 1Kb upstream of the TSS), UTRs, exons and CDS regions. The schematic above illustrates the positions of genic regions
![Figure 6. Distribution of Methylated Regions (MRs) annotated to specific genomic regions. (a). Peak and gene associations obtained by analysing the annotations of nearby genes and regulatory elements wherein genomic distances are divided into bins relative to transcription start site (TSS) as [0, 5 kb], [5 kb, 50 kb], [50 kb, 500 kb], [500 kb, infinity]. Values on the Y-axis represent per cent of peaks found in a given genomic region (b). Genic annotations of DMRs include 1–5Kb upstream of the TSS, the promoter (< 1Kb upstream of the TSS), UTRs, exons and CDS regions. The schematic above illustrates the positions of genic regions](/cms/asset/ff06929c-8cce-459d-a2ae-abdaa6811f92/kepi_a_1834923_f0006_oc.jpg)