Figures & data
Figure 1. Experimental design and samples collection. With the exception of A36h, all lines have been previously tested for their response to acute thermal challenges [Citation29] and their status is mentioned: R for resistant, I for intermediate and S for sensitive. dpf: days post-fertilization
![Figure 1. Experimental design and samples collection. With the exception of A36h, all lines have been previously tested for their response to acute thermal challenges [Citation29] and their status is mentioned: R for resistant, I for intermediate and S for sensitive. dpf: days post-fertilization](/cms/asset/28215649-b784-4d64-8320-6c7ece249406/kepi_a_1834924_f0001_oc.jpg)
Table 1. Primers used for gene expression analysis of hsp47 and dnmt3 by qPCR. E: qPCR efficiency
Figure 2. Analysis strategy of EpiRADseq data. DH and PM count tables are the results of PstI/MspI sequence libraries, PH count tables are the results of the PstI/HpaII sequence libraries. Filters were applied per line on PstI/HpaII EpiRADseq loci count tables. PM filter: loci with positive counts for at least 3 out of 6 PstI/MspI libraries were kept. DH filter: loci with positive counts in at least one of the two doubled haploid parents PM libraries
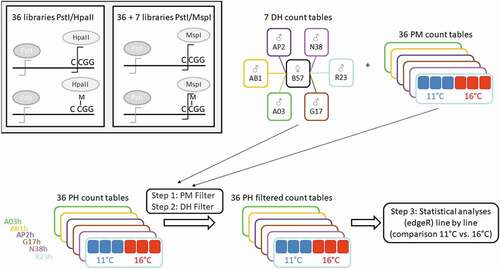
Figure 3. Comparison of hsp47 gene transcription at 16°C in nine rainbow trout isogenic lines, as expressed as fold change relative to control 11°C and expressed as mean ± SE. Status of the lines: R for resistant, I for intermediate and S for sensitive. 19 dpf (days post-fertilization): three days after the beginning of the temperature treatment; 22 dpf: at the end of the temperature treatment. Data are not available for line R23h at 22 dpf due to technical problems during RNA extraction, meaning that the samples were lost
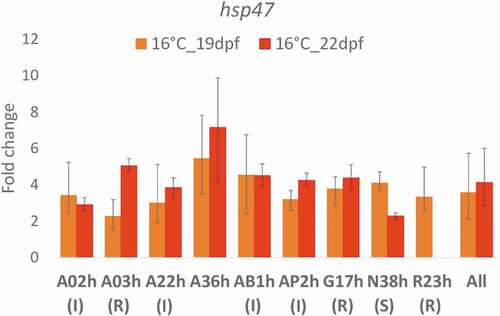
Table 2. Gene expression of eight dnmt3 genes at 16°C, expressed as fold change (FC) relative to the control 11°C, performed line by line
Figure 4. Global DNA methylation assessed at eyed-stage (22 dpf) by LUMA (LUminometric Methylation Assay) in nine rainbow trout isogenic lines at two incubation temperatures, 11°C vs. 16°C, expressed as mean ± SE. Status of the lines: R for resistant, I for intermediate and S for sensitive. Two-sample Fisher–Pitman permutation tests performed line by line revealed no effect of incubation temperature on global DNA methylation levels. For each incubation temperature, K-sample Fisher–Pitman permutation tests were performed, followed by non-parametric testing of Tukey-type multiple comparisons: * indicate the lines with significantly (p < 0.05) lower global DNA methylation level compared to the other lines
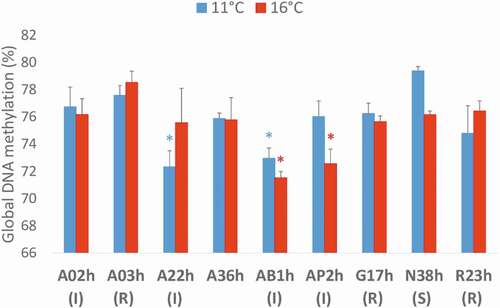
Table 3. Number of filtered EpiRADseq loci per line
Figure 5. Number of EpiRADseq loci shared between two and six rainbow trout isogenic lines, and number of line-specific EpiRADseq loci
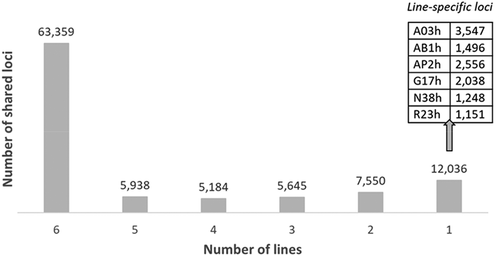
Figure 6. Percentages of EpiRADseq loci that mapped to various categories of annotated genomic regions of the rainbow trout genome (Omyk_1.0). Upstream: within 1 kb upstream of annotated genic regions. Downstream: within 1 kb downstream of annotated genic regions
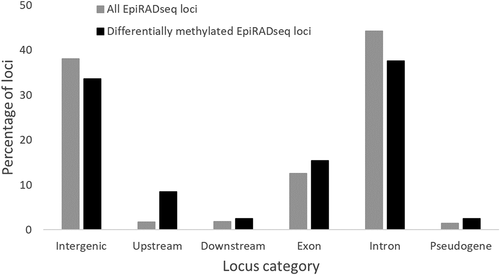
Figure 7. Number of unique and shared differentially methylated loci between the two temperature conditions (11°C vs. 16°C) for six rainbow trout isogenic lines, using UpSetR package [Citation56]. Down: number of loci that were less methylated at 16°C compared to 11°C; Up: number of loci that were more methylated at 16°C compared to 11°C
![Figure 7. Number of unique and shared differentially methylated loci between the two temperature conditions (11°C vs. 16°C) for six rainbow trout isogenic lines, using UpSetR package [Citation56]. Down: number of loci that were less methylated at 16°C compared to 11°C; Up: number of loci that were more methylated at 16°C compared to 11°C](/cms/asset/fb1bad15-f0d2-4c2c-bc89-f324cf5abc89/kepi_a_1834924_f0007_b.gif)
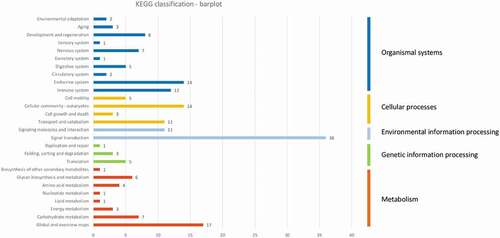
Figure 8. Descriptive KEGG pathway classification bar plot obtained using the genes found in the 385 differentially methylated EpiRADseq loci. The horizontal bars represent the absolute number of genes found in second-level KEGG pathways, grouped in first-level KEGG pathways using a colour code. The vertical bars on the right indicate the names of first-level pathways