Figures & data
Figure 1. Cisplatin resistance in testicular germ cell tumour (TGCT) cells is associated with global DNA CpG hypermethylation. (a) Principal component analysis using beta values of all CpG sites from Illumina EPIC array of parental 2102EP, NT2/D1, 833 K cells and isogenic-derived resistant cells 2102EP-B3, 2102EP-C1, NT2/D1-C2 and 833 K-B4 in biological triplicate. (b) Total number of differentially methylated CpG sites in indicated resistant cells compared to matching parental cells, FDR < 0.05, absolute delta beta ≥ 0.2. (c) Volcano plots of all CpG sites for each resistant cell line compared to parent. Blue and yellow indicate hypermethylated and hypomethylated CpGs, respectively, with FDR < 0.05 and absolute delta beta ≥ 0.2. Number of differentially methylated CpGs is indicated. (d) Unsupervised cluster analysis of beta values of 20,000 most highly variable CpGs across all resistant and parental cell lines in biological triplicate
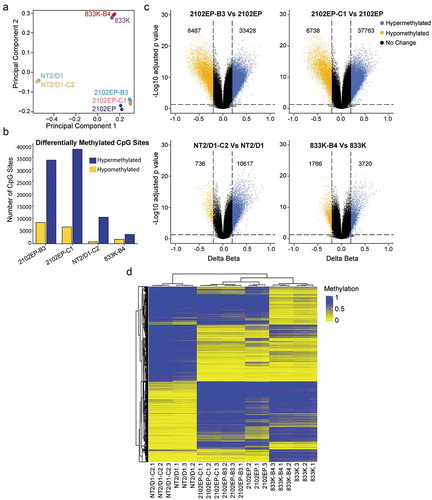
Figure 2. DNA CpG hypermethylation in resistant TGCT cells is consistent across most genomic features. (a) Number of significantly changed CpG beta values between cisplatin-resistant and parental cells grouped by hypermethylation and hypomethylation and CpG location related to CpG islands; FDR < 0.05, absolute delta beta ≥ 0.2. (b) Number of significantly changed CpG beta values between cisplatin-resistant and parental cells grouped by hypermethylation and hypomethylation and CpG location related to genomic feature; FDR < 0.05, absolute delta beta ≥ 0.2
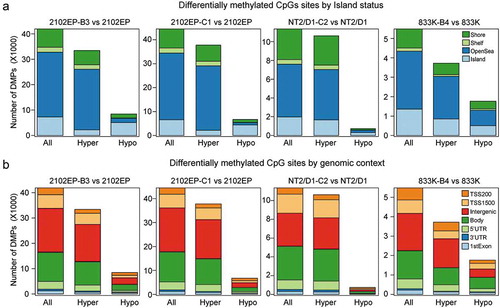
Figure 3. Hypomethylated CpGs in resistant TGCT cells are associated with polycomb regulated regions and hypermethylated CpG are associated with nuclear organization of repressive chromatin. (a) Locus overlap analysis (LOLA) for significantly hypomethylated CpGs genomic regions in resistant cells using pan-cistrome databases from Encode reveals enrichment of hypomethylated CpGs in EZH2 and SUZ12 binding sites. (b) LOLA for significantly hypomethylated CpGs genomic regions in resistant cells using a custom embryonal stem cell and embryonal carcinoma cell database reveals enrichment of hypomethylated CpGs in H3K27me3 sites. (c) LOLA for significantly hypermethylated CpGs genomic regions in resistant cells using pan-cistrome databases from Encode reveals enrichment of hypermethylated CpGs in CTCF and RAD21 binding sites
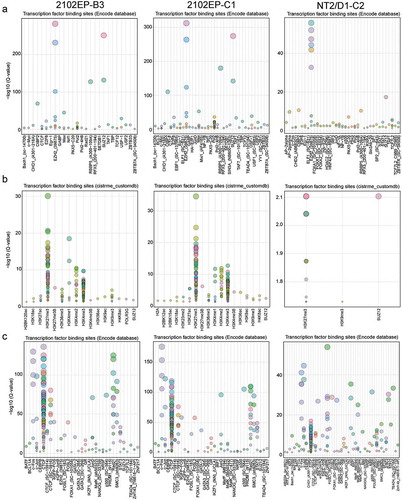
Figure 4. Cisplatin-resistant TGCT cells have a global negative correlation between gene promoter and CpG island methylation and gene expression. Scatter plot of delta beta and fold-change values of all significantly methylated CpGs (FDR < 0.05, absolute delta beta ≥ 0.2) that also mapped to all significantly regulated genes in resistant cells vs respective parent cells. All CpGs, CpGs located in promoter regions (TSS1500, TSS200, ‘5UTR and 1st exon), and CpGs located in island, shore or shelf regions are depicted
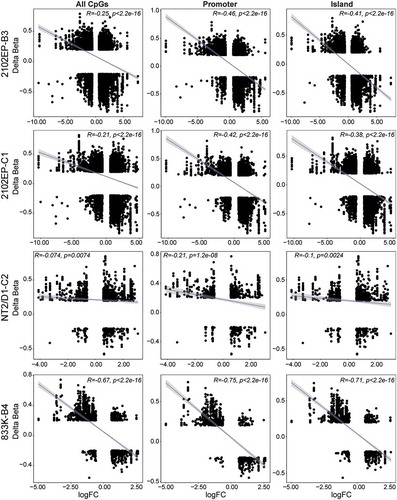
Figure 5. Distinct groupings of differentially methylated CpG sites correlate with distinct patterns of gene expression in cisplatin-resistant TGCT cells. (a) Schematic of groupings of all significantly methylated CpG sites that mapped to all significantly regulated genes in cisplatin-resistant cells compared to parent cells. Also provided are total number of CpGs and genes for each grouping in each cell line. (b) Scatter plot of biological triplicate beta and gene expression values for an example CpG/gene pair for each grouping in each resistant cell line
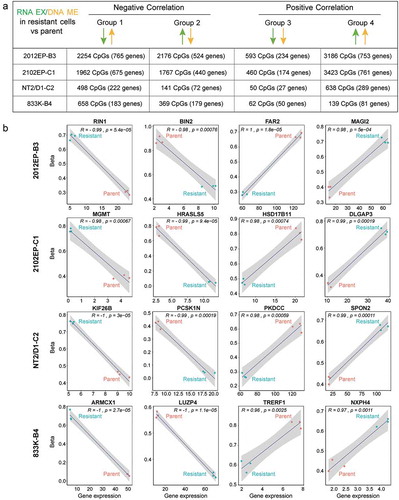
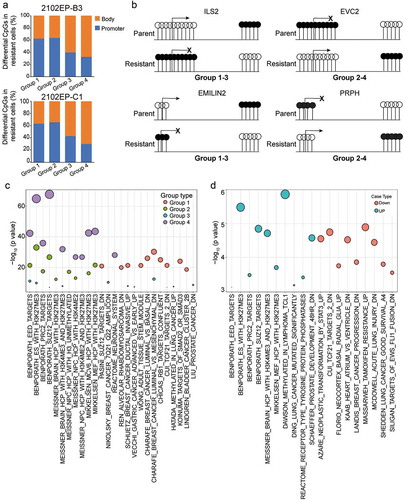
Figure 6. Evidence for a location-specific relationship between altered CpG methylation and altered gene expression and a bidirectional shift in promoter and gene body methylation in cisplatin-resistant TGCT cells. (a) Number of CpG sites with significantly altered methylation in cisplatin-resistant cells for each grouping from Figure 5A reveals enrichment of differentially methylated CpGs in promoter regions (TSS1500, TSS200, ‘5UTR and 1st exon) for groups with negative correlation in CpG methylation and gene expression (Group 1 and 2) and enrichment of differentially methylated CpGs in gene body regions for groups with positive correlation in CpG methylation and gene expression (Group 3 and 4). (b). Specific examples of genes demonstrating bi-directional alterations in significantly altered CpG methylation between promoter and gene body regions in cisplatin-resistant cells compared to parent. A shift from gene body to promoter methylation is associated with decreased gene expression in resistant cells (combination of Group 1 and 3) and a shift from gene promoter to gene body CpG methylation is associated with increased gene expression in resistant cells (combination of Group 2 and 4). (c) Overlap analysis between genes of each grouping in 2102EP-B3 cells and the MSigDB C2 collection of curated gene sets reveals enrichment of polycomb targets in groups 4 and 2 and cancer-related tumour suppressor genes in groups 1 and 3. (d) Overlap analysis between hypermethylated non-CpGs in 2102EP-B3 cells and the MSigDB C2 collection of curated gene sets reveals enrichment of polycomb targets in upregulated genes and enrichment of cancer-related tumour suppressor genes in downregulated genes