
Figures & data
Figure 1. Mouse treatment paradigm showing timing of Pb exposure and animal sacrifice/tissue collection. Dams were exposed to normal chow and either control or Pb‐acetate water, starting two weeks prior to mating, through gestation, until offspring were weaned on postnatal day 21. At this point, Pb exposure ceased and offspring were administered control water and chow. At 5 months of age, matched liver and blood tissues were collected for DNA methylation analysis. Pb doses and average blood lead levels are shown
Table 1. Litter parameters
Table 2. Differentially methylated cytosines (DMCs) in female and male blood and liver identified using ERRBS
Table 3. Differentially methylated regions (DMRs) in female and male blood and liver identified using ERRBS
Figure 2. Volcano plots showing differentially methylated regions (DMRs) for lead vs. control in female blood (a), female liver (b), male blood (c), and male liver (d). Blue: regions significantly hypomethylated with Pb exposure. Green: regions significantly hypermethylated with Pb exposure
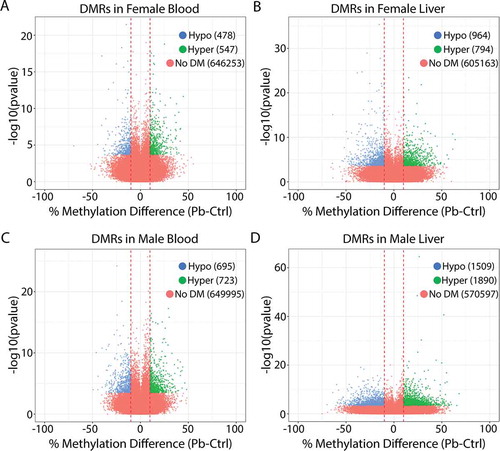
Figure 3. Pie charts depicting the overlap between DMRs in each sex and their respective sex-specific enhancer states in female blood (a), female liver (b), male blood (c) and male liver (d). Totals are the number of DMR-enhancer overlaps for each condition. Published enhancers are from Sugathan and Waxman, Mol. Cell. Biol. 2013, and chromatin states are defined according to the degree of enrichment with H3K4me1, H3K27Ac, and DNAse hypersensitivity (DHS): State 5 – low K4me1, medium K27ac, high DHS; State 6 – high K4me1, high K27ac, high DHS; State 9 – high K4me1, high K27ac, low DHS; State 10 – low K4me1, medium K27ac, low DHS; State 11 – high K4me1, low K27ac, low DHS
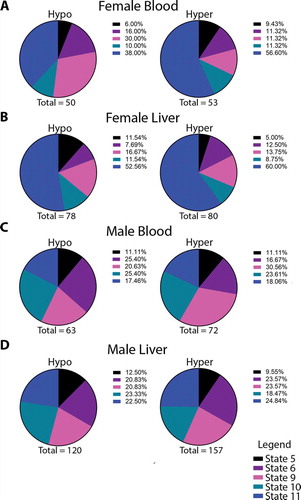
Table 4. Differentially methylated cytosines (DMCs) identified at imprinted loci in female blood and liver
Table 5. Differentially methylated cytosines (DMCs) identified at imprinted loci in male blood and liver
Figure 4. Lollipop diagrams showing differentially methylated cytosines (DMCs) with Pb exposure in: (a) Gnas in male and female liver, (b) Meg3 in male and female blood, (c) Begain in male blood and liver, (d) Peg12 in male blood and liver, (e) Rasgrf1 in male blood and liver, and (f) Snrpn in male blood and liver
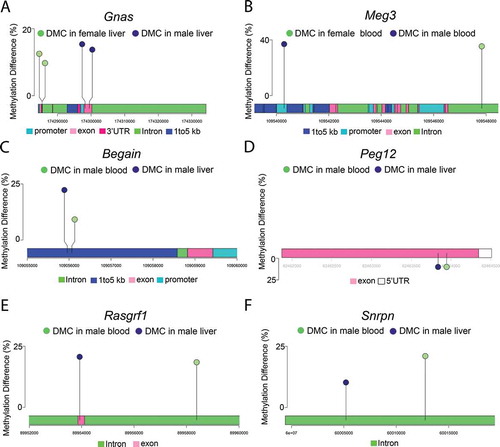
Figure 5. qRT-PCR data depicting Gnas expression in livers from female (a) and male (b) mice. Gnas expression was determined relative to the geometric mean of the Ct values for housekeeping genes Actb, Hmbs, and Psmc4. Since some of the male and female mice were littermates, data were analysed using linear mixed effects regression with litter-specific random effects to account for within-litter correlation
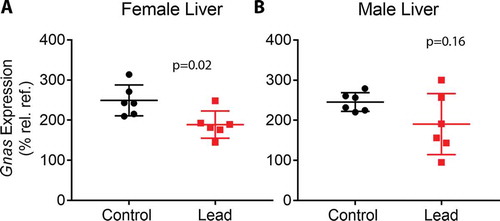
Table 6. Overlap between differentially methylated cytosines/regions (DMCs/DMRs) in female blood and liver
Table 7. Overlap between differentially methylated cytosines/regions (DMCs/DMRs) in male blood and liver
Figure 6. Analysis of overlapping DMC-associated genes in females (a) and males (b). Panels C-D denote genes in blood (c) and liver (d) that are in common across sexes. Panel E depicts the number of genes in common across sex and tissue. Numbers in circles indicate the total number of DMC-associated genes in each tissue. All overlaps were statistically significant, as indicated by hypergeometric test (panel A: p < 2.7x10−46, panel B: p < 1.1x10−73, panel C: p < 9.459x10−59, panel D: p < 2.656x10−90, panel E: p < 3.227x10⁻³⁰). In the tables, # Genes indicates the number of genes in the specified GO pathway that appear in the experimental dataset. Pathway analysis was conducted using DAVID, version 6.8 (Laboratory of Human Retrovirology and Immunoinformatics (LHRI))
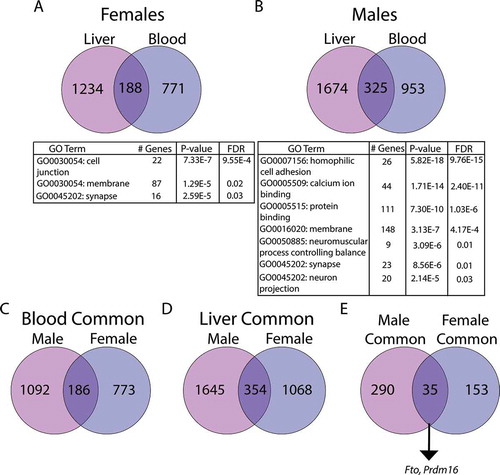
Figure 7. Effects of Pb exposure on gene expression in mouse blood and liver at two time points. Normalized RNA-seq read count data for females (a,c) and males (b,d) for Fto and Wwox. Top graphs in each panel depict gene expression in a cohort of animals sacrificed at 5 months of age (the same animals used for ERRBS), and bottom graphs show gene expression at postnatal day (PND) 21, when animals were weaned and Pb exposure stopped. A cohort of animals were sacrificed for gene expression analysis at this time point. Statistical significance was determined using linear mixed effects regression
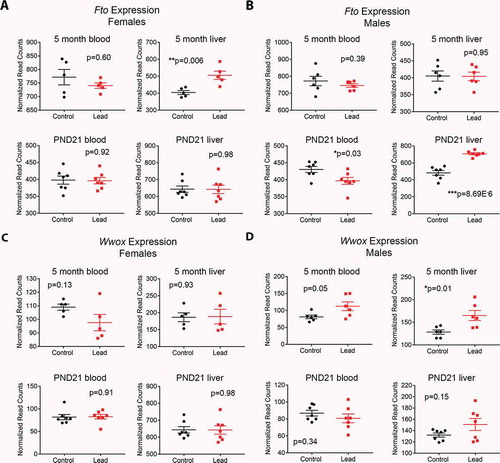
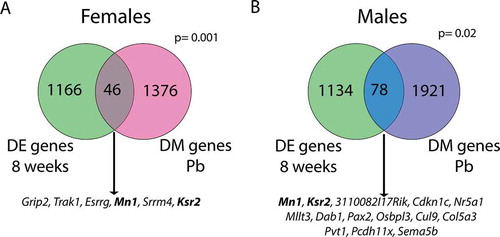
Figure 8. Overlap between genes with differential methylation (DM genes Pb) and genes that are differentially expressed in male vs. female liver at 8 weeks of age (DE genes 8 weeks). Separate analyses were conducted in females (a) and males (b). Genes listed below each diagram are those that also exhibit differential methylation in the blood of either females (A) or males (B). Bold genes are differentially methylated with Pb exposure in both tissues and sexes, and are differentially expressed between sexes in 8 week mouse liver. P values (hypergeometric test) represent the significance of overlap between gene lists
Supplemental Material
Download Zip (14.1 MB)Data Availability
ERRBS sequencing data have been uploaded to GEO (accession number GSE150670). RNA-seq data are available from the TaRGET II Consortium: https://targetepigenomics.org/.