
Figures & data
Table 1. Key demographic and clinical characteristics of participants
Table 2. Model fit statistics assessing methylation-mortality association
Figure 1. A plot of the relationship of the relationship of the PhenoAge to GrimAge in the FHS cohort (R2 = 0.62)
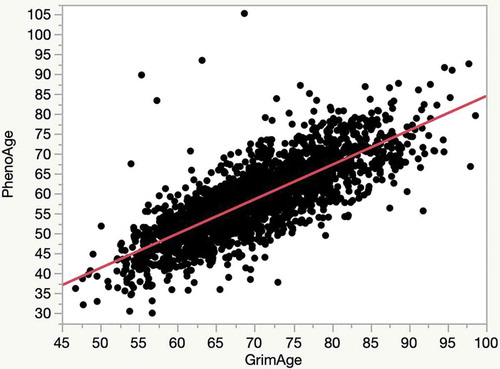
Table 3. Hazard ratio estimates for Model 5
Figure 2. Plots of the relationship of Illumina array methylation values (x-axis) to that of digital PCR values (y-axis) for each of the markers in the predictor set for the subjects in the FACHS study. The R2 for each of the correlations with their corresponding Illumina probe values is: Dcg05575921, 0.96; Dcg04987734, 0.93; Dcg19693031, 0.90; Dcg00300879, 0.95
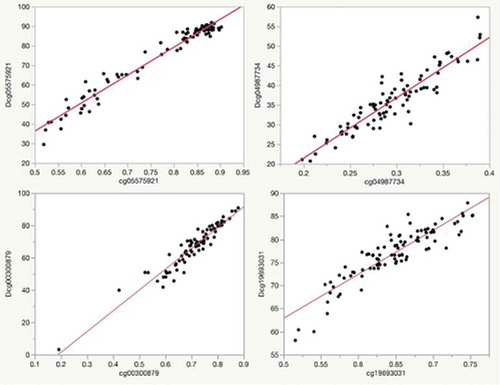
Table 4. Internal validation: bootstrap results
Table 5. Demographic characteristics and digital PCR methylation values for the adults subjects from the family and community health study subjects
Table 6. Demographic and digital PCR methylation values for adolescents from the health iowa study