Figures & data
Table 1. Primers and linkers
Figure 1. Hairpin amplification, sequencing and processing. A. Following bisulphite conversion, the region of interest was amplified using tagged specific primers. A second round of PCR was used to label the samples with indexed Illumina primers. B. Summary of the analysis of methylation data. The methylation of each CpG is displayed and the status of each hairpin is interpreted after ‘folding’ the complimentary strands
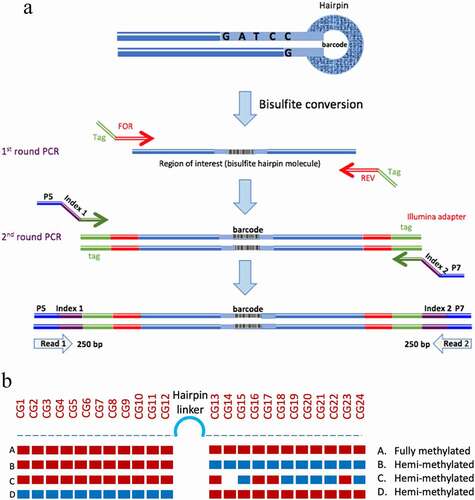
Figure 2. DNA ploidy analysis of Jurkat cells following release from thymidine block. The upper series shows untreated Jurkat cells whereas the lower series shows cells treated with 5 μM decitabine. DNA content of cells was measured by propidium iodine staining
Figure 3. Global CpG methylation levels of decitabine-treated and untreated Jurkat cells measured by low-coverage bisulphite sequencing. The error bars indicate the theoretical 99.5% confidence intervals of the methylation value (see methods)
Figure 4. Example of decitabine-induced hemi-methylation in Jurkat cells. A. The left panel shows the almost fully methylated PCDHGA12 promoter at time 0 h. The right panels show the development of hemi-methylation of the PCDHGA12 promoter in decitabine-treated cells 2 to 12 h after initiation of DNA replication. Each line is a unique sequence read; the number of unique sequences is shown at the bottom of each heatmap. B. Enlargement of the lower portion of the heatmap of the decitabine-treated cells at 12 h to show the hemi-methylated reads. The dotted line indicates the location of the hairpin barcode. The heatmaps in A and B are outputs from BiQ Analyzer HT. Red = methylated CpG, blue = unmethylated CpG, white = non-aligned sequence. C. Percentage of hemi-methylated sequences in the PCDHGA12 promoter in decitabine-treated Jurkat cells following initiation of DNA replication. The data presented are means of three replicates ± SEM. The level of hemi-methylation in the untreated controls was <1% at all time points
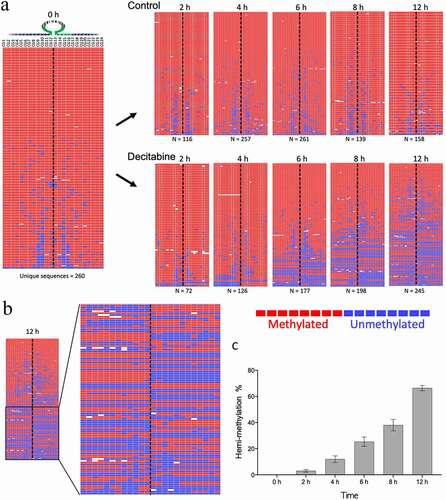
Figure 5. Demethylation and re-methylation of the PCDHGA12 promoter in Jurkat cells. A. Methylation pattern of hairpin sequence reads from untreated and decitabine-treated cells for up to 120 h after initiation of DNA replication. The heatmaps are outputs from BiQ Analyzer HT. Red = methylated CpG, blue = unmethylated CpG, white = missing sequence. B. Distribution of methylation, hemi-methylation and unmethylation in untreated and decitabine-treated cells as a function of time
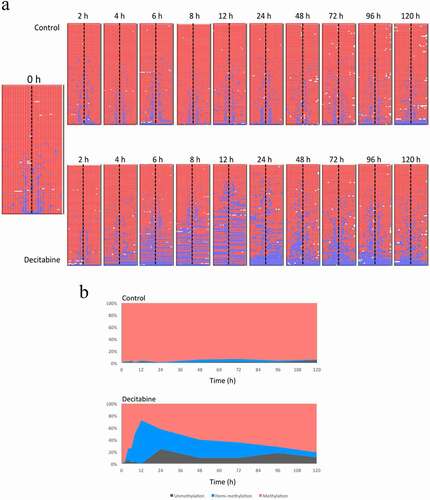
Figure 6. Methylation of RASSF1 promoter in Jurkat cells treated with decitabine compared to untreated cells. Heatmap output of BiQ Analyzer HT
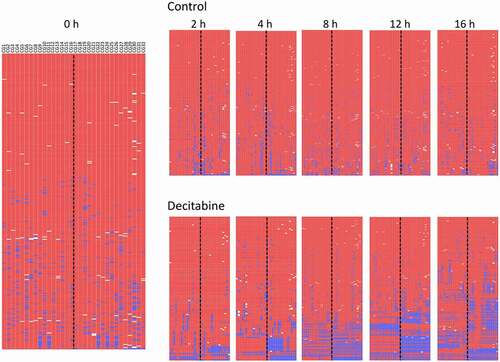
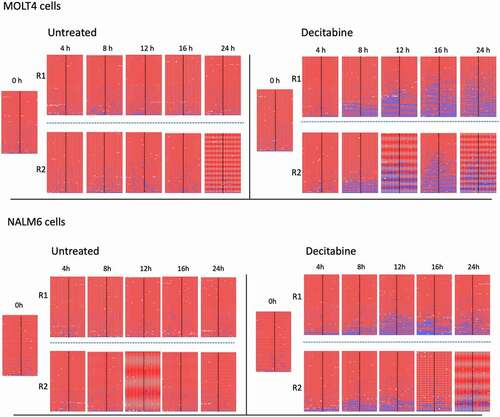
Figure 7. Methylation of PCDHGA12 promoter in decitabine-treated MOLT4 and NALM6 cells. Biological replicates (R1 and R2) are shown for each condition