
Figures & data
Table 1. Demographic characteristics of 184 participants in the current study
Figure 1. Overall study design flowchart
Figure 2. Association with IgA nephropathy (a). Manhattan plot for the association with IgA nephropathy. The blue line corresponds to the threshold of epigenome-wide significance (FDR = 0.1) (b). QQ plot for the EWAS of IgA nephropathy, lambda = 1.12
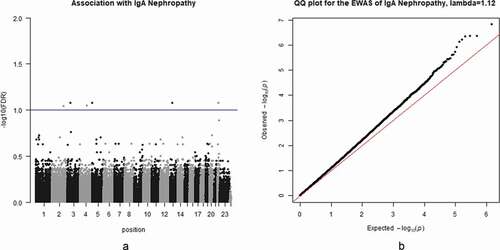
Figure 3. (a) Heatmap of association with methylation network modules: correlation coefficient of linear mix model between module eigengene(ME) and IgAN status (IgAN), cell purity (Purity), gender and smoking status(SMK) is reported with the -log10(p-value) given inside the bracket; the degree of -log10(p-value) is illustrated with the colour legend. (b) Visualization of Magenta Module: genes in the centre are the hub genes, pairwise correlation: 0.13 to 1
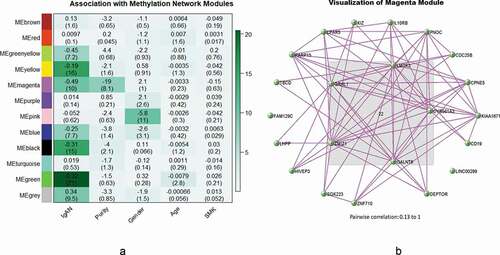
Table 2. Significant probes (FDR<0.01) in all the significant modules