Figures & data
Figure 1. Summary of reprogramming in this study
Figure 2. Methylation at BWS-related imprinting control regions in iPSC clones
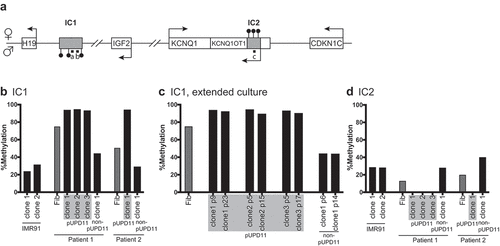
Figure 3. RNA-Seq expression profiles in control lines, non-UPD11, and pUPD11 patient cell lines. (a) Venn diagram demonstrating the statistically significant differentially expressed genes (DGE) identified by DESeq2 when comparing all non-pUPD11 and pUPD11 patient-derived lines to control hepatocytes (blue oval) and those identified when comparing the pUPD11 iPSC lines from both patients to the non-pUPD11 lines from both patients grouped with the control lines (red oval). (b) Heatmap of transformed expression data for growth and liver cancer genes differentially expressed across groups identified through GSEA
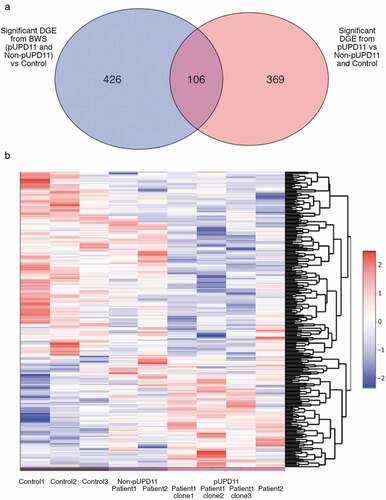
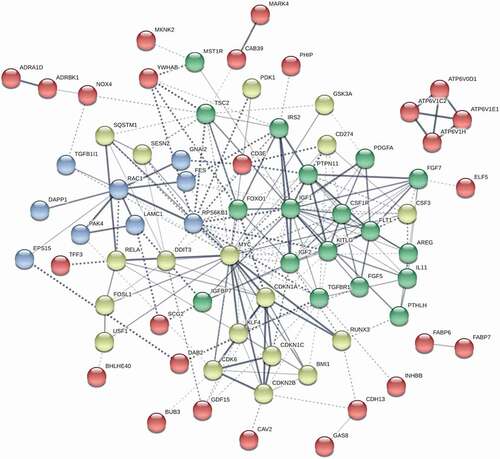
Figure 4. Network of interactome among differentially expressed genes in BWS iPSC lines differentiated into hepatocyte lineages. pUPD11 lines were compared to non-UPD11 and control lines. Genes were identified by GSEA enrichment. Green clusters of nodes are largely components of insulin signalling and connect to IGF2. Cell proliferation pathways are indicated by blue and yellow clusters, with the yellow cluster specifically regulating cell cycle progression including CDKN1C. Edges between gene nodes indicate confidence in the interaction by the intensity of the line. Kmeans clustering was set to 8 and disconnected nodes were hidden