Figures & data
Figure 1. miRNA regulation of ADAM17. (a) Predicted miRNA binding sites for ADAM17. (b) Exogenous miRNAs suppress ADAM17 in HCT116 cells. Left panel representative blots; β-actin band below ADAM17 is shown as a loading control. right panel densitometry of two independent experiments, *p < 0.05 compared to scrambled (Scr) miRNA. (c) Expression of luciferase regulated by WT or mutant ADAM17-3’UTR in cells transfected with indicated miRNAs. *p < 0.05 comparing targeted miRNA to control Scr assayed with WT ADAM17-3’UTR; †p < 0.05 comparing targeted or Scr miRNA + mutant ADAM17-3’UTR to targeted miRNA +WT ADAM17-3’UTR (n = 3 independent platings in replicates of 8)
Figure 2. (a) Cell-specific distribution of miRNAs in normal human colon and colon cancers. Stromal cells and colonocytes were prepared from surgical specimens of human tumours and adjacent normal appearing tissue as described in the Methods. Indicated miRNAs were quantified by real-time PCR with values normalized to 1 in whole (non-fractionated) tissue. Note the relative enrichment of miR-143, miR-145, and miR-152 in stromal cells and the relative enrichment of miR-148a in the colonocyte fraction. miR-143 ap<0.05 whole tissue vs stroma; bp<0.005 whole tissue versus colonocytes; cp<0.001 stroma vs colonocytes; dp<0.005 stroma vs tumour stroma. miR-145: ep<0.05 stroma vs colonocytes; miR-148a: fp<0.005 stroma vs colonocytes; gp<0.05 colonocytes vs tumour colonocytes, miR-152: hp<0.05 stroma vs tumour stroma. (b) Cell-specific distribution of miRNAs in normal mouse colon and mouse colon tumours. Cellular fractions were prepared from fresh colonic mucosa from control and conditional Apc+/LoxP-cdx2-P-Cre mice as described in the Methods. RNA was prepared and indicated miRNAs quantified by real-time PCR. Expression levels were normalized to 1 in whole (non-fractionated) tissue. Note the relative enrichment of miR-143, miR-145a and miR-152 in stromal cells and relative enrichment of miR-148a in the colonocyte fraction. miR-143: ap<0.05, whole tissue vs stroma, bp<0.05, stroma vs colonocytes. cp<0.05, stroma vs tumour stroma, dp<0.05, stroma vs tumour colonocytes, ep<0.05 colonocytes vs tumour stroma; miR-145: fp<0.005 whole tissue vs colonocytes, gp<0.05 whole tissue vs tumour stroma, hp<0.005 stroma vs colonocytes, ip<0.05 stroma vs tumour stroma; miR-148a: jp<0.05 whole tissue vs tumour stroma, kp<0.05 stroma vs colonocytes, lp<0.05 colonocytes vs tumour stroma, mp<0.005 colonocytes vs tumour colonocytes; miR-152: np<0.005 whole tissue vs colonocytes, op<0.05 whole tissue vs tumour colonocytes. (c) Western diet and tumour development down-regulate miR-143 and miR-145a with a similar trend for miR-148a and miR-152. Mice were fed standard diet (Std diet, 5% fat) or Western diet (20% fat) and treated with AOM or saline as described [Citation8]. After 40 wks mice were sacrificed and colonic mucosa from left colon scrape-isolated and RNA extracted. miRNAs were measured by real-time PCR. Diet significantly reduced miR-143 and miR-145a with even greater reductions in tumours. miR-143: ap<0.005; bp<0.01 cp<0.0005 compared to Std diet; miR-145a: dp<0.01; ep<0.02; fp<0.005; compared to Std diet. miR-148a: gp<0.05, hp<0.005 compared to Std diet; miR-152: ip<0.001, compared to standard diet
![Figure 2. (a) Cell-specific distribution of miRNAs in normal human colon and colon cancers. Stromal cells and colonocytes were prepared from surgical specimens of human tumours and adjacent normal appearing tissue as described in the Methods. Indicated miRNAs were quantified by real-time PCR with values normalized to 1 in whole (non-fractionated) tissue. Note the relative enrichment of miR-143, miR-145, and miR-152 in stromal cells and the relative enrichment of miR-148a in the colonocyte fraction. miR-143 ap<0.05 whole tissue vs stroma; bp<0.005 whole tissue versus colonocytes; cp<0.001 stroma vs colonocytes; dp<0.005 stroma vs tumour stroma. miR-145: ep<0.05 stroma vs colonocytes; miR-148a: fp<0.005 stroma vs colonocytes; gp<0.05 colonocytes vs tumour colonocytes, miR-152: hp<0.05 stroma vs tumour stroma. (b) Cell-specific distribution of miRNAs in normal mouse colon and mouse colon tumours. Cellular fractions were prepared from fresh colonic mucosa from control and conditional Apc+/LoxP-cdx2-P-Cre mice as described in the Methods. RNA was prepared and indicated miRNAs quantified by real-time PCR. Expression levels were normalized to 1 in whole (non-fractionated) tissue. Note the relative enrichment of miR-143, miR-145a and miR-152 in stromal cells and relative enrichment of miR-148a in the colonocyte fraction. miR-143: ap<0.05, whole tissue vs stroma, bp<0.05, stroma vs colonocytes. cp<0.05, stroma vs tumour stroma, dp<0.05, stroma vs tumour colonocytes, ep<0.05 colonocytes vs tumour stroma; miR-145: fp<0.005 whole tissue vs colonocytes, gp<0.05 whole tissue vs tumour stroma, hp<0.005 stroma vs colonocytes, ip<0.05 stroma vs tumour stroma; miR-148a: jp<0.05 whole tissue vs tumour stroma, kp<0.05 stroma vs colonocytes, lp<0.05 colonocytes vs tumour stroma, mp<0.005 colonocytes vs tumour colonocytes; miR-152: np<0.005 whole tissue vs colonocytes, op<0.05 whole tissue vs tumour colonocytes. (c) Western diet and tumour development down-regulate miR-143 and miR-145a with a similar trend for miR-148a and miR-152. Mice were fed standard diet (Std diet, 5% fat) or Western diet (20% fat) and treated with AOM or saline as described [Citation8]. After 40 wks mice were sacrificed and colonic mucosa from left colon scrape-isolated and RNA extracted. miRNAs were measured by real-time PCR. Diet significantly reduced miR-143 and miR-145a with even greater reductions in tumours. miR-143: ap<0.005; bp<0.01 cp<0.0005 compared to Std diet; miR-145a: dp<0.01; ep<0.02; fp<0.005; compared to Std diet. miR-148a: gp<0.05, hp<0.005 compared to Std diet; miR-152: ip<0.001, compared to standard diet](/cms/asset/a561a1f0-d15d-4461-afb8-74341e47c388/kepi_a_1863117_f0002_b.gif)
Figure 3. Lysates from mouse colonocytes, but not human colon cancer cells, can process pre-miR-143 to mature miR-143. Pre-miR-143 was transcribed in vitro with α32P-UTP. Lysates from primary mouse colonocytes and HCT116 colon cancer cells were prepared. 32P-pre-miR-143 processing was assayed as described in the Methods. (a) Processing by soluble extracts from human HCT116 cells and mouse colonocytes. (b) Processing by mouse colonocyte fractions separated on a superpose HPLC column. Fractions (0.5 ml) were assayed for ability to process 32P-pre-miR143 to mature 32P-miR-143. C. Pre-miR-143 processing by mouse colonocytes is not inhibited by addition of human colon cancer (HCT116) or bladder cancer cell (T24, UM-UC-3) extracts. Comparable results were obtained in two independent experiments
Figure 4. Villin-pre-miR-143, pre-miR-145 transgenic mouse. (a) Transgene (Tg) structure. (b) Genotyping of founder lines from tail snip DNA. (c) Expression levels of colonocyte miR-143 and miR-145 in WT and Tg mice. Levels of miR-143 and miR-145 in miR-143 KO and miR-145 KO mice are also shown. a, c, d, e p<0.0001, bp<0.0005, compared to miR-143 in Tg mice; f,hp<0.05, g p<0.0005, i, j p<0.005, compared to miR-145 in Tg mice. Note the first column for miR-143 group and the second column for miR-145 group were undetectable as these were KO mice for the respective miRNAs. (d) DSS colitis. *Disease activity index for all time points > 6 d were significantly lower in Tg mice compared to WT mice (p<0.005, Tukey’s HSD correction)
Figure 5. AOM-DSS treated Tg mice have significantly lower tumour incidence and tumour burden and reduced colonocyte proliferation and tumour size. Tg mice and CD1 littermate controls were treated with AOM weekly for 2 wks followed by 3 cycles of DSS as described in the Methods. (a). Tumour and cancer incidence. (b) Tumour multiplicity. Kruskal Walis statistics. (c) Ki67 staining a, b p < 0.0001 compared to WT-ctl; cp<0.001 compared WT -adj, dp<0.0001 Tg-ctl vs. Tg-adj ep<0.0001 Tg-ctl vs Tg-Tumour, fp<0.0001 Tg Tumour vs WT Tumour. (d) Tumour size
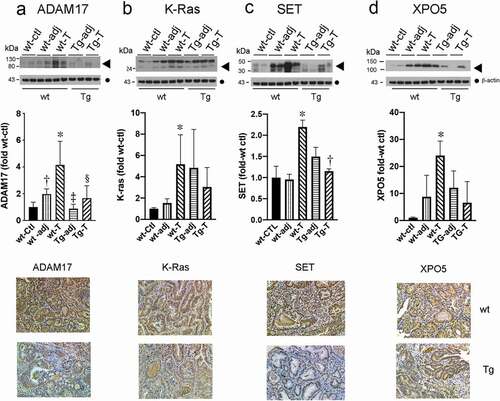
Figure 6. Putative targets of miR-143 and miR-145 are up-regulated in tumours from wild type (WT) but not Tg mice compared to control mucosa. Upper panel Western blots of the indicated proteins (◀︎). As loading controls, separate aliquots of the indicated samples were run on a second blot and probed for β-actin (●) (n = 4 separate mice with matching adjacent and tumour tissue middle panel quantitative densitometry. lower panel IHC. A. ADAM17 *p < 0.005 WT-T compared to WT-ctl; †p < 0.05 WT-adj compared to WT-T; ‡p < 0.005 WT-T compared to Tg-adj; §p < 0.05 WT-T compared to Tg-T. B. K-ras *p < 0.05 WT-T compared to WT-ctl. C. SET *p < 0.05 WT-T compared to WT-ctl, †p < 0.05 WT-T compared to Tg-T D. XPO5 *p < 0.05 WT-T compared to WT-ctl