Figures & data
Figure 1. Mortality curves of Pacific salmon infected with P. salmonis. The figure shows the cumulative mortality of the four replicates (tanks) (E1–E4)
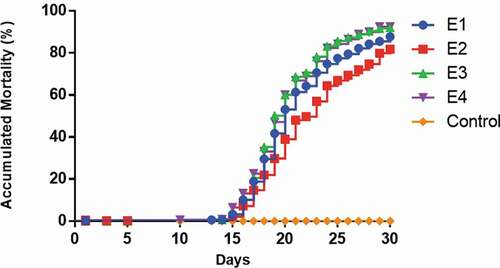
Figure 2. (a) Comparative distribution (%) of DMCs genomic features (intergenic regions, promoters, introns and exons) and genomics features of the totality of CpG sites filtered. Outer and inner rings represent distribution of DMCs and filtered CpG sites, respectively. *: p < 0.05 (G-tets). (b) General DMR heatmap profile comparing pooled infected and control Pacific salmon organism
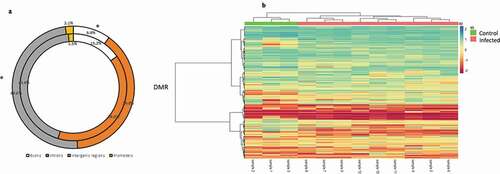
Figure 3. (a–c) Manhattan plots of the chromosomal distribution of differentially methylated CpGs loci among infected and control Pacific salmon in (a) 1 dpi, (b) 5 dpi and (c) 15 dpi. Each point means an individual DMC with genomic location on the x-axis and DMC percentage of methylation on the y-axis. Dashed line represent limit among hypo and hypermethylated loci. (d) Frequency of hypo and hypermethylated DMCs along the Pacific salmon genome in 1 dpi – 15 dpi
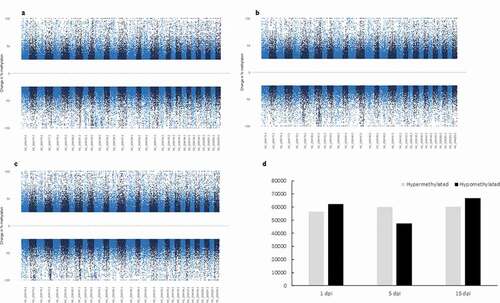
Figure 4. (a–c) Comparative distribution (%) of DMCs genomic features (intergenic regions, promoters, introns and exons) and genomics features of the totality of CpG sites filtered in (a) 1 dpi, (b) 5 dpi and (c) 15 dpi. Outer and inner rings represent distribution of DMCs and filtered CpG sites, respectively. *: p < 0.05 (G-tets). (d-f) DMR heatmap profile comparing infected and control Pacific salmon in (d) 1 dpi, (e) 5 dpi and (f) 15 dpi
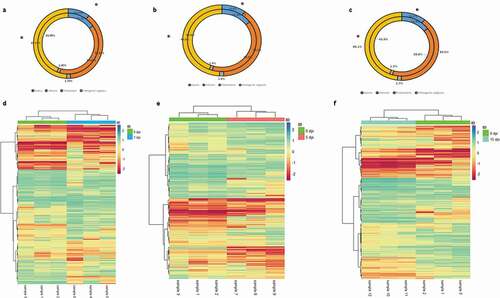
Figure 5. Venn diagram of unique and shared DMRs across the disease
Figure 6. (a–c) Distribution of unique and shared enriched GO terms of associated DMRs loci across the disease. (a) cellular component (b) biological process and (c) molecular function. (d) Distribution of unique and shared enriched KEGG categories of associated DMRs loci across the disease