
Figures & data
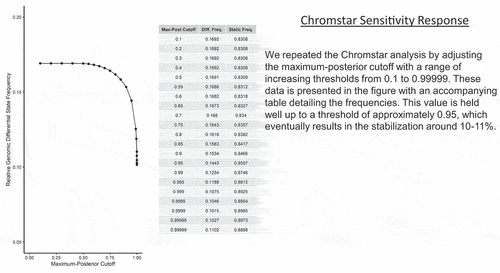
Figure 1. CTCF sites are differentially bound at TSS promoter regions of Cr(VI)-treated cells. CTCF ChIP-seq data for control and 1 µM Cr(VI)-treated Hepa-1 cells were processed using the ENCODE ChIP-seq pipeline [Citation34,Citation35] to provide a foundation for downstream analyses. Approximately 80,000 peaks were called for both conditions when compared to total input; this was further optimized for high confidence regions by selecting for peaks with an FDR 0.01 in the optimal set called by SPP [Citation61,Citation62], then using Homer [Citation64] to identify peaks that contained the canonical CTCF motif. (a) Following peak selection, DiffBind [Citation54,Citation55] was used to identify differentially-bound sites between Cr-treated and control samples. Points density was calculated by binning peaks into 200 segments, represented by their frequency. Sites with statistical significance threshold of p-value
0.05 are highlighted in blue and red. (b) DeepTools265 was used to assess the signal of differentially-bound sites in each subset. Signal values were computed for each replicate bigwig (1X normalized) with an extension of ± 1 Kb on the flanking regions. The mean value of the replicates for each bin is represented. (c) Homer [Citation64] was used to provide annotation statistics for the subsets of regions. Sites were progressively binned by their distance to the nearest TSS. The asterisks represent the mean of 500 repeated subsampling iterations with the standard error (selecting n = 365 for Cr-Enriched and n = 450 for Cr-Depleted) within the global peak population (n = 46,394) to provide an accurate representation of expected peak profiles. (d) Log2 ratios were calculated using Homer’s [Citation64] ‘annStats’ flag with default parameters. Red and blue values represent significant Cr-Enriched and Cr-Depleted peaks respectively; numbers next to each bar indicate the number of peaks in each category and annotations with 0 occurrences were excluded. Promoter regions are considered to be within −1 Kb to +100 bp of the TSS
![Figure 1. CTCF sites are differentially bound at TSS promoter regions of Cr(VI)-treated cells. CTCF ChIP-seq data for control and 1 µM Cr(VI)-treated Hepa-1 cells were processed using the ENCODE ChIP-seq pipeline [Citation34,Citation35] to provide a foundation for downstream analyses. Approximately 80,000 peaks were called for both conditions when compared to total input; this was further optimized for high confidence regions by selecting for peaks with an FDR ≤ 0.01 in the optimal set called by SPP [Citation61,Citation62], then using Homer [Citation64] to identify peaks that contained the canonical CTCF motif. (a) Following peak selection, DiffBind [Citation54,Citation55] was used to identify differentially-bound sites between Cr-treated and control samples. Points density was calculated by binning peaks into 200 segments, represented by their frequency. Sites with statistical significance threshold of p-value ≤ 0.05 are highlighted in blue and red. (b) DeepTools265 was used to assess the signal of differentially-bound sites in each subset. Signal values were computed for each replicate bigwig (1X normalized) with an extension of ± 1 Kb on the flanking regions. The mean value of the replicates for each bin is represented. (c) Homer [Citation64] was used to provide annotation statistics for the subsets of regions. Sites were progressively binned by their distance to the nearest TSS. The asterisks represent the mean of 500 repeated subsampling iterations with the standard error (selecting n = 365 for Cr-Enriched and n = 450 for Cr-Depleted) within the global peak population (n = 46,394) to provide an accurate representation of expected peak profiles. (d) Log2 ratios were calculated using Homer’s [Citation64] ‘annStats’ flag with default parameters. Red and blue values represent significant Cr-Enriched and Cr-Depleted peaks respectively; numbers next to each bar indicate the number of peaks in each category and annotations with 0 occurrences were excluded. Promoter regions are considered to be within −1 Kb to +100 bp of the TSS](/cms/asset/b622133b-8f56-472c-8b2d-a4eef07cf1db/kepi_a_1864168_f0001_oc.jpg)
Figure 2. Genes near affected CTCF sites are functionally important and exhibit transcriptional change. Following the annotation of differentially-bound CTCF sites, a subset of genes with an affected site was selected using a cut-off of TSS ± 5 Kb. (a) The log2 fold change in transcription for this subset of genes was mapped using previously published RNA-seq data from our lab (GSE49571, Table S5)[Citation44]. Genes are coloured by the differential-binding status of the CTCF site with select labelling. The dotted line represents the threshold of an adjusted p-value 0.05. (b) Histone modification profiles across genes in each subset were quantified using DeepTools265 and the mean signal from each sample subset is represented. (c) Enrichr [Citation45,Citation46] was used to provide functional annotations for same gene subsets. The top 10 biological processes, as ranked by the -log10 p-value, are represented
![Figure 2. Genes near affected CTCF sites are functionally important and exhibit transcriptional change. Following the annotation of differentially-bound CTCF sites, a subset of genes with an affected site was selected using a cut-off of TSS ± 5 Kb. (a) The log2 fold change in transcription for this subset of genes was mapped using previously published RNA-seq data from our lab (GSE49571, Table S5)[Citation44]. Genes are coloured by the differential-binding status of the CTCF site with select labelling. The dotted line represents the threshold of an adjusted p-value ≤ 0.05. (b) Histone modification profiles across genes in each subset were quantified using DeepTools265 and the mean signal from each sample subset is represented. (c) Enrichr [Citation45,Citation46] was used to provide functional annotations for same gene subsets. The top 10 biological processes, as ranked by the -log10 p-value, are represented](/cms/asset/f73eb989-16c4-4149-99d2-25fbb288e9f5/kepi_a_1864168_f0002_oc.jpg)
Figure 3. Changes in chromatin states are localized effects. DeepTools265 and ChromstaR [Citation52] were used to assess global signal patterns and characterize chromatin states. (a) Each biological replicate was used to measure the 1x normalized signal across the genome in 1 Kb bins. Spearman’s rank correlation was performed to determine the degree of similarity compared with all other samples and conditions. (b) Chromatin states were classified using ChromstaR [Citation52] with the mode set to ‘combinatorial’, a bin size 1 Kb bins, and a step size of 500 bp. States were considered ‘Static’ if there was no change in the classification between the control and Cr(VI)-treated samples, and ‘Differential’ (‘Diff’) if they were distinct. Following this categorization, the proportion of the genome that falls under each classification was summarized. (c) The global and differentially-bound set of CTCF peaks identified using DiffBind [Citation54,Citation55] were intersected with the subset of differential chromatin state transitions. To account for substantial differences in region numbers, the global population was repeatedly subsampled (n = 846, iterations = 500) and the mean is reported with the standard error
![Figure 3. Changes in chromatin states are localized effects. DeepTools265 and ChromstaR [Citation52] were used to assess global signal patterns and characterize chromatin states. (a) Each biological replicate was used to measure the 1x normalized signal across the genome in 1 Kb bins. Spearman’s rank correlation was performed to determine the degree of similarity compared with all other samples and conditions. (b) Chromatin states were classified using ChromstaR [Citation52] with the mode set to ‘combinatorial’, a bin size 1 Kb bins, and a step size of 500 bp. States were considered ‘Static’ if there was no change in the classification between the control and Cr(VI)-treated samples, and ‘Differential’ (‘Diff’) if they were distinct. Following this categorization, the proportion of the genome that falls under each classification was summarized. (c) The global and differentially-bound set of CTCF peaks identified using DiffBind [Citation54,Citation55] were intersected with the subset of differential chromatin state transitions. To account for substantial differences in region numbers, the global population was repeatedly subsampled (n = 846, iterations = 500) and the mean is reported with the standard error](/cms/asset/18d091e2-489a-4576-b0ba-38a3e8fc14bd/kepi_a_1864168_f0003_oc.jpg)
Figure 4. IntraTAD chromatin loop predictions suggest subtle differences in enrichment of histone modification signals. The algorithm proposed by Matthews and Waxman was implemented independently for control and treated conditions with minor modifications to capture as many potential loops as possible prior to merging [Citation53]. (a) The number of distinct, predicted intra-TAD interactions for each condition were quantified. (b) Loop size was then calculated as the distance between each candidate pair’s start and end. (c) Loop candidates were passed to DeepTools265 to measure histone modification signals across candidate loop regions which were normalized to a common length and then extended by 5 Kb in either direction to quantify signal activity outside of the looping interactions using a bin size of 100 bp. The mean of each bin is presented. The symbols A(l)/A(r) represent the left and right anchors of the loop, respectively
![Figure 4. IntraTAD chromatin loop predictions suggest subtle differences in enrichment of histone modification signals. The algorithm proposed by Matthews and Waxman was implemented independently for control and treated conditions with minor modifications to capture as many potential loops as possible prior to merging [Citation53]. (a) The number of distinct, predicted intra-TAD interactions for each condition were quantified. (b) Loop size was then calculated as the distance between each candidate pair’s start and end. (c) Loop candidates were passed to DeepTools265 to measure histone modification signals across candidate loop regions which were normalized to a common length and then extended by 5 Kb in either direction to quantify signal activity outside of the looping interactions using a bin size of 100 bp. The mean of each bin is presented. The symbols A(l)/A(r) represent the left and right anchors of the loop, respectively](/cms/asset/d8cee5bb-74fe-495c-b462-976c0ee2dc18/kepi_a_1864168_f0004_oc.jpg)
Figure 5. Differentially-bound anchors display altered histone modification profiles. Predicted loop regions were intersected with the population of CTCF sites tested in DiffBind [Citation54,Citation55] to identify peaks that are predicted to be anchors. (a) Regions were considered as anchors if the start or end value was found within a peak. A total of 7,548 peaks were classified as potential anchors prior to thresholding (also termed ‘Predicted Anchors’). Signals for each histone modification were calculated using DeepTools265 computeMatrix in reference-point mode. (b) Anchor peaks were then filtered to select significant sites (pval 0.05) and classified as either ‘Cr-Enriched’ or ‘Cr-Depleted’ based on the log2 fold change. Data is represented as the mean signal per bin for each group and the number of observations are provided in parentheses
![Figure 5. Differentially-bound anchors display altered histone modification profiles. Predicted loop regions were intersected with the population of CTCF sites tested in DiffBind [Citation54,Citation55] to identify peaks that are predicted to be anchors. (a) Regions were considered as anchors if the start or end value was found within a peak. A total of 7,548 peaks were classified as potential anchors prior to thresholding (also termed ‘Predicted Anchors’). Signals for each histone modification were calculated using DeepTools265 computeMatrix in reference-point mode. (b) Anchor peaks were then filtered to select significant sites (pval ≤ 0.05) and classified as either ‘Cr-Enriched’ or ‘Cr-Depleted’ based on the log2 fold change. Data is represented as the mean signal per bin for each group and the number of observations are provided in parentheses](/cms/asset/8dbb10f9-58b5-418f-b122-982cd0278b35/kepi_a_1864168_f0005_oc.jpg)