Figures & data
Figure 1. Glucocorticoid exposure leads to gene expression and DNA methylation changes in the Fkbp5 locus in multiple brain regions. (a). Four-week corticosterone (CORT) treatment leads to an increase in Fkbp5 expression in all four brain regions examined: amygdala (AMYG), hippocampus (HIPPO), hypothalamus (HYPO), and prefrontal cortex (PFC). (b). Spatial organization of four CpG dinucleotides assayed by bisulphite PCR and pyrosequencing for DNA methylation. CpGs are located within the fifth intron of the Fkbp5 gene and are adjacent to two tandem GREs. (c). CORT-induced loss of methylation at the four intronic CpGs in four brain regions examined. (d). Absence of methylation changes at three CpGs located in the first intron of Fkbp5. N = 4 per group. Bar graphs are represented as mean ± SEM, and statistical significance was determined by Student’s t-tests: *p < 0.05, **p < 0.01, and ***p < 0.001
Figure 2. Partial reversal and persistence of GC-induced loss of DNA methylation in a cell line. (a). Two of the four CpGs (CpG-1 and CpG-2) in the Fkbp5 intron 5 undergo a gradual but partial reversal of dexamethasone (DEX)-induced loss of DNA methylation during the 32-day recovery period in the absence of DEX. (b). Two CpGs (CpG-3 and CpG-4) do not undergo any appreciable reversal of DEX-induced methylation loss. (c). Three CpGs in intron 1 of Fkbp5 do not undergo any changes in DNA methylation during the 10-day treatment with DEX. The Y-axis range is shown with a smaller scale than for the intron 5 CpGs to emphasize the methylation levels across the recovery period. (d). Assessment of Fkbp5 gene expression across the DEX treatment and recovery periods shows the transient nature of DEX-induced transcription. N = 3 per treatment group per day. Line graphs are represented as mean ± SEM, and methylation levels at all time points for (a) and (b) were significantly different between the DEX-treated samples and their corresponding VEHICLE-treated samples as determined by Student’s t-tests: (p < 0.001). For the expression study, Students’ t-tests were also performed: **p < 0.01
Figure 3. DNA methylation status of intron 5 and a consensus GRE is associated with gene expression. (a). AtT-20 cells were first treated with DEX (Demethylated) or vehicle (Methylated) solution for 7 days and cultured for an additional 7 days without DEX. On the eighth day, cells were stimulated with either 1 μM DEX or VEHICLE solution for 4 hours to measure Fkbp5 expression. (b). Schematic drawing of three tandem GR binding sites that were subcloned upstream of a luciferase reporter cDNA. Other than the two CpGs that flank the GREs (or the four CpGs associated with the Fkbp5 intron 5 DNA fragment in )), the vector does not contain any CpGs. (c). Unmethylated or SssI-methylated fragments were transfected into the cell line, and luciferase assay was performed 2 days post-transfection following 24 hrs. of exposure to DEX or VEHICLE solution. Fkbp5 ± Meth denotes the unmethylated or methylated Fkbp5 intron 5, and GRE ± Meth denotes unmethylated or methylated consensus GREs. N = 3 per treatment group. Bar graphs are represented as mean ± SEM, and statistical significance was determined by Student’s t-tests: *p < 0.05, **p < 0.01, and ***p < 0.001
Figure 4. Effect of 5-aza-2ʹ-deoxycytidine (AZA) on GC-induced loss of DNA methylation. (a). DNA methylation levels of DEX- or VEHICLE-treated HT-22 cells were examined under different concentrations of AZA. CpG-4 from intron 5 is shown, but all CpGs underwent GC- and AZA-induced loss of DNA methylation. (b). In contrast, as expected, three CpGs at intron 1 underwent AZA-induced loss of DNA methylation only. N = 4 per treatment group. Bar graphs are represented as mean ± SEM, and statistical significance was determined by Student’s t-tests: *p < 0.05, **p < 0.01, and ***p < 0.001
Figure 5. GC-induced loss of methylation depends on cell replication. (a). HT-22 cells were treated with 10 μg/mL mitomycin C (MMC) for three hours, washed several times, and cultured for 7 days in the presence of 1 μM CORT or VEHICLE solution. MMC blocked CORT-induced loss of DNA methylation at all intron 5 CpGs. N = 3 per group. (b). To replicate the results in HT-22 cells, MTT assay was performed on AtT-20 cells treated with different concentrations of nocodazole (NCO) and 1 μM CORT or VEHICLE solution to find an NCO concentration capable of inhibiting cell proliferation. N = 7 per treatment group. (c). Methylation levels at Fkbp5 intron 5 show a failure to undergo CORT-induced loss of DNA methylation at 50 nM NCO, where a substantial reduction in cell proliferation was observed. N = 7 per treatment group. Bar graphs are represented as mean ± SEM. P-value asterisks determined by Student’s t-tests are for VEH vs. CORT and MMC+VEH vs. MMC+CORT. *p < 0.05, **p < 0.01, and ***p < 0.001
Figure 6. Methyl CpG-binding repressor MECP2 binds Fkbp5 intron 5, and its loss of function or reduction leads to increased levels of Fkbp5 expression. (a). HT-22 cells treated for 5 days with 1 μM DEX or VEHICLE solution were used in a ChIP assay to examine the occupancy of the glucocorticoid receptor (αGR) and MeCP2 at Fkbp5 intron 5. N = 4 per treatment group. DNA associated with GR or MeCP2 were assessed by qPCR for enrichment of the intron 5 region. An intergenic region from the mouse Chromosome 11 and a promoter GRE at the Pomc gene were used as negative and positive controls, respectively, for qPCR. (b). A lentiviral plasmid encoding a GFP-fused Cas9 protein and sgRNA targeting the third exon of Mecp2 was introduced into HT-22 cells. Following two days of culturing, cells were washed and treated with 1 μM DEX or VEHICLE solution for 4 hrs. GFP+ cells that indicated successful lentiviral transduction and sgRNA/Cas9 expression were isolated by fluorescence-activated cell sorting (FACS). (c). GFP+ (Mecp2-) and GFP- (Mecp2+) cells that were treated with DEX or VEHICLE solution were assayed for Fkbp5 expression. N = 3 per treatment group. (d). Lentiviral plasmids encoding four shRNAs against Mecp2 were introduced into HT-22 cells to knockdown Mecp2 expression. RT-qPCR showed a variable response of the four shRNA plasmid clones in terms of their ability to reduce Mecp2 levels. A scrambled shRNA plasmid was used as a negative control (Neg). N = 3 per shRNA clone. (e). Expression levels of Fkbp5 in the four shRNA clones were determined following a 4-hr treatment with 1 μM DEX or vehicle solution. Data are displayed as fold change over vehicle-treated samples whose relative expression was set to ‘1.’ N = 3 per shRNA clone. (f). Linear regression analysis shows a modest correlation between baseline Mecp2 levels in the shRNA-transfected cells and Fkbp5 levels in corresponding shRNA-transfected cells treated with DEX. Bar graphs are represented as mean ± SEM, and statistical significance was determined by Student’s t-tests: *p < 0.05, **p < 0.01, and ***p < 0.001
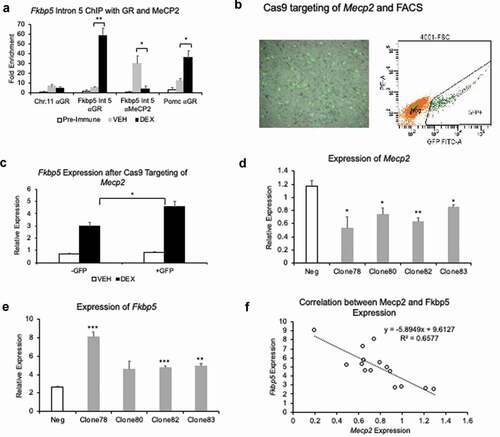
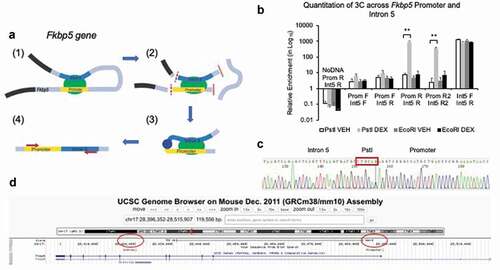
Figure 7. GC-treatment induces a physical interaction between the Fkbp5 promoter and intron 5. (a). A schematic drawing shows a GC-induced physical interaction between the promoter and intron 5 of Fkbp5 (1) with each having at least one PstI site in common (2). Digestion of cross-linked chromatin with PstI (2) followed by religation would enable the concatenation and formation of a promoter-intron 5 hybrid if they are in close proximity to each other (3). Small red arrows indicate the approximate locations of one set of primers used for PCR amplification (4). Additional introns and exons at the top of the loop between the promoter and intron 5 are not shown in the diagram. (b). HT-22 cells treated with DEX show a physical interaction between the two genomic regions, as assessed by qPCR. Primers against the promoter (Prom F and R) and intron 5 (Int5 F and R) were used in different combinations to demonstrate that PstI-digested and religated DNA-protein complexes, but not EcoRI-digested samples, showed a physical interaction. Prom R2 and Int5 R2 primers are located further away from the PstI site compared to the Prom R and Int5 R primers, respectively. (c). Sanger sequencing of the PCR product shows the concatenation of the promoter and intron 5 regions demarcated by PstI. (d). The BLAT function on the UCSC Genome Browser was used to show that the DNA sequence aligned to both the promoter and intron 5 of Fkbp5. Bar graphs are represented as mean ± SEM, and statistical significance was determined by Student’s t-tests: **p < 0.01