Figures & data
Table 1. Anthropometric and metabolic parameters before and after the intervention period in non-responders and responders
Figure 1. Volcano plot showing the differential methylation probes (DMP) between responders and non-responders. Volcano plot for DMP with raw p-value < 0.05, deltaBeta ≥ |5|% and B-Limma ≥ 0. Effect size is displayed along X-axis, highlighting deltaBeta ≥ |5|%. On the Y-axis is displayed the negative logarithm of the association (adjusted p-value) for each CpG site. Points below the horizontal grey line are not statistically significant according to B-Limma and FDR 0.05. The red dots represent the 63 CpGs significant after filtering by B-Limma ≥ 0, and deltaBeta ≥ |5|% (adjustment 1).
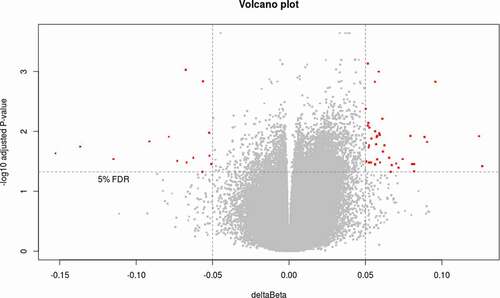
Table 2. Genomic data of CpG sites in a DMR located at PON3 gene at baseline. Methylation levels (beta values) of CpG sites located at PON3 gene in non-responders and responders
Figure 2. Differentially methylated regions (DMRs) identification. Plot representing the comparison (between responders and non-responders) of the methylation levels of the individual CpGs included in the DMR identified in PON3 gene. Solid lines represent mean values and dashed lines represent the Loess line, where a hypermethylation is observed in the responders group (pink solid line). TSS1500: Transcription Start Site that covers 200 to 1500 nucleotides upstream of TSS.
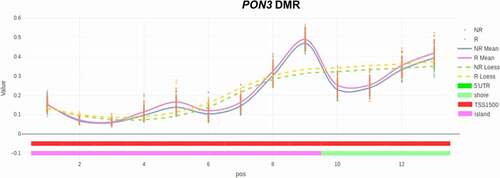
Figure 3. BMI loss and DNA methylation. (a) Correlation between DNA methylation levels (z-score) in PON3 DMR and BMI loss and (b) correlation between DNA methylation levels (z-score) in PON3 DMR and PON3 protein levels in serum.
Figure 4. Oxidized LDL and paraoxonase activity. (a) Oxidized LDL levels (oxLDL) in Non-Responders and Responders at baseline. (b) Correlation between oxLDL levels and paraoxonase (PON) activity in serum. ns: non-significant.
Figure 5. Z-score and glucose metabolism. Relation between z-scores of PON3 DMR methylation and glucose metabolism parameters. Values reflect the significant change in z-scores from DMR methylation (11 CpG sites) according to insulin (a) or HOMA-IR at baseline (b).