
Figures & data
Table 1. Prime sequence for RT-qPCR
Table 2. KEGG analysis of target genes of long noncoding RNA LINC00619
Figure 1. LncRNA LINC00619 is poorly expressed in osteosarcoma and coexpressed with HGF. A: A heat map of the aberrantly expressed lncRNAs in osteosarcoma. The characters (1–22, X, Y) outside the big circle represent chromosomes, with the location of aberrantly expressed lncRNAs noted in corresponding position. In the central part, each rectangle represents the corresponding lncRNA expression in each sample. Differential expression analysis is achieved through comparison with the expression of host cells prior to treatment. Red indicates high expression, whereas blue represents poor expression. B: lncRNA LINC00619 and HGF coexpression trend detected using the MEM website. The colour scale is from dark red to dark blue, and red indicates smaller ranks (smaller is better).
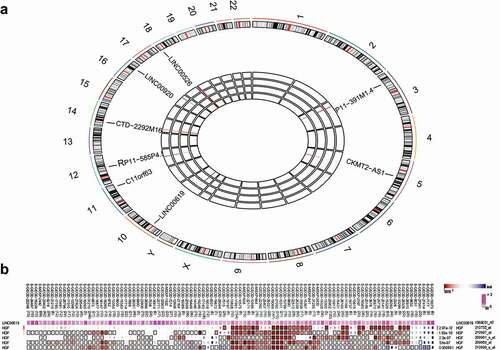
Figure 2. Osteosarcoma tissues exhibit increased positive rates of HGF protein. A: Immunohistochemistry staining of osteochondroma tissues (n = 35) and osteosarcoma tissues (n = 72); B: HGF positive rate in osteochondroma and osteosarcoma tissues; *, p < 0.05 compared with osteochondroma tissues. Data were presented as mean ± standard deviation and the comparison between two groups was analysed by t-test.
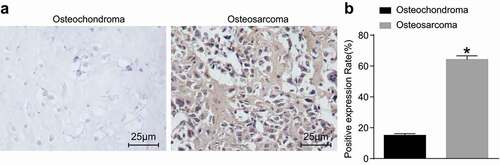
Figure 3. PCNA, HGF, PI3K, Akt, Bcl-2, ALP and OPN expression is increased, whereas Bax and lncRNA LINC00619 expression is reduced. A: mRNA expressions of genes related to osteochondroma (n = 35) and osteosarcoma (n = 72) tissues; B: protein expressions of genes related to osteochondroma and osteosarcoma tissues; C: protein bands of related proteins in osteochondroma and osteosarcoma tissues; n = 3. *, p < 0.05 compared with osteochondroma tissues. Data were presented as mean ± standard deviation and the comparison between two groups was analysed by unpaired t-test.
Figure 4. HGF is a target gene of lncRNA LINC00619. A: Bioinformatics website predicted binding sites between HGF and lncRNA LINC00619; B: detection of luciferase activity by dual-luciferase reporter gene assay; HGF gene vector (pmiRRB-HGF-3ʹUTR) was synthetically constructed, which was cotransfected with lncRNA LINC00619 vector, siRNA-lncRNA LINC00619, vector NC, or siRNA-NC into osteosarcoma cells. Cells were collected for detection of luciferase activity. C: RT-qPCR of lncRNA LINC00619 expression and HGF mRNA expression in osteosarcoma cells; D: western blot analysis of HGF protein expression in osteosarcoma cells. E: protein bands of HGF in osteosarcoma cells. n = 3. *, p < 0.05 compared with the NC group. Data were presented as mean ± standard deviation and the comparison among multiple groups was analysed ANOVA.
Figure 5. PCNA, HGF, PI3K, Akt, bcl-2, ALP and CPN expression in osteosarcoma tissues is downregulated by lncRNA LINC00619. Osteosarcoma cells were treated with lncRNA LINC00619, HGF, si-lncRNA LINC00619 and si-HGF vectors alone or in combination. A: RT-qPCR analysis of PCNA, HGF, PI3K, Akt, bcl-2, ALP and CPN expression in osteosarcoma cells; B, western blot analysis of protein expression of PCNA, HGF, PI3K, Akt, bcl-2, ALP and CPN and the extent of PI3K and Akt phosphorylation in osteosarcoma cells. n = 3. *, p < 0.05 indicated significant difference of gene or protein expression when compared with the blank group or the empty vector group; &, p < 0.05 indicated significant difference of gene or protein expression when compared with the lncRNA LINC00619 vector group, #, p < 0.05 indicated significant difference of gene or protein expression when compared with the siRNA-lncRNA LINC00619 group. Data were presented as mean ± standard deviation and the comparison among multiple groups was analysed by ANOVA.
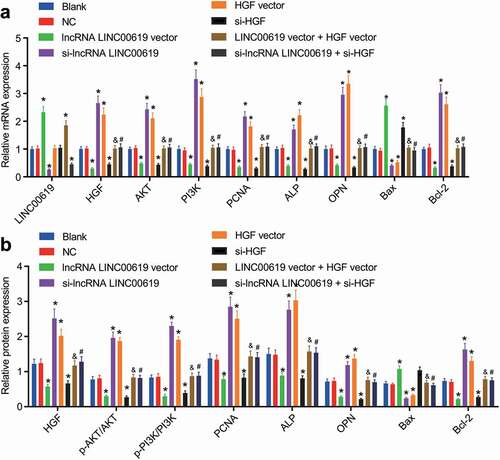
Figure 6. LncRNA LINC00619 represses the proliferation of osteosarcoma cells. Osteosarcoma cells were treated with lncRNA LINC00619, HGF, si-lncRNA LINC00619 and si-HGF vectors alone or in combination. *, p < 0.05 compared with the blank group; &, p < 0.05 compared with the lncRNA LINC00619 vector group, #, p < 0.05 compared with the siRNA-lncRNA LINC00619 group. Data were presented as mean ± standard deviation. The data obtained by multiple measurements at different time points were analysed using two-way ANOVA.
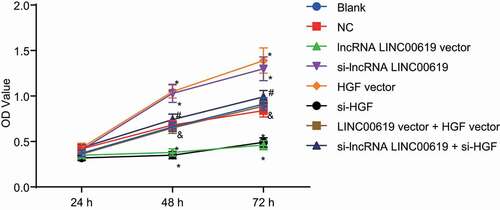
Figure 7. LncRNA LINC00619 downregulates cell migration in osteosarcoma cells. Osteosarcoma cells were treated with lncRNA LINC00619, HGF, si-lncRNA LINC00619 and si-HGF vectors alone or in combination. A: representative images of cell migration in each group (× 100); B: migration distance for each group, *, p < 0.05 compared with the blank group; &, p < 0.05 compared with the lncRNA LINC00619 vector group, #, p < 0.05 compared with the siRNA-lncRNA LINC00619 group. Data were presented as mean ± standard deviation and the comparison among multiple groups was analysed by ANOVA.
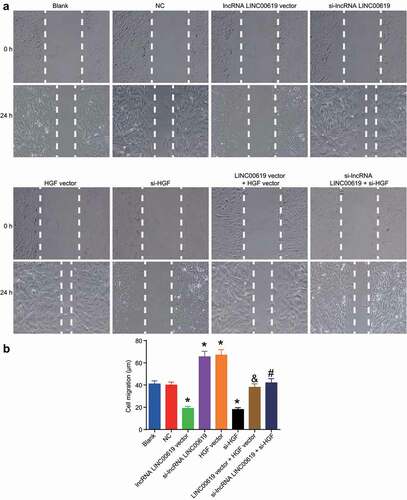
Figure 8. LncRNA LINC00619 inhibits the invasive ability of osteosarcoma cells. Osteosarcoma cells were treated with lncRNA LINC00619, HGF, si-lncRNA LINC00619 and si-HGF vectors alone or in combination. A: representative images of cell invasion (× 200); B: number of invasive cells, *, p < 0.05 compared with the blank group; &, p < 0.05 compared with the lncRNA LINC00619 vector group, #, p < 0.05 compared with the siRNA-lncRNA LINC00619 group. Data were presented as mean ± standard deviation and the comparison among groups was analysed by ANOVA.
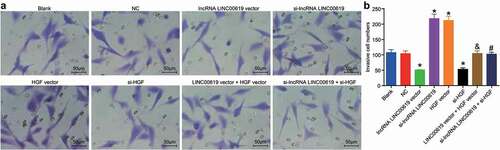
Figure 9. LncRNA LINC00619 enhances osteosarcoma cell apoptosis. Osteosarcoma cells were treated with lncRNA LINC00619, HGF, si-lncRNA LINC00619 and si-HGF vectors alone or in combination. A: cell cycle distribution in each group; B: cell apoptosis rate in each group; *, p < 0.05 compared with the blank group; &, p < 0.05 compared with the lncRNA LINC00619 vector group, #, p < 0.05 compared with the siRNA-lncRNA LINC00619 group. Data were presented as mean ± standard deviation and the comparison among multiple groups was analysed by ANOVA.
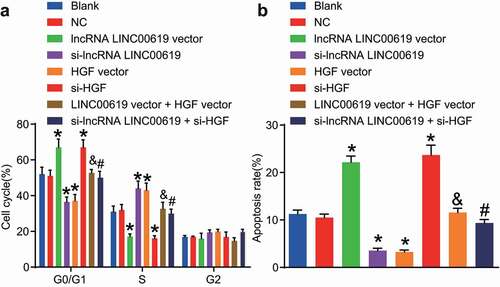
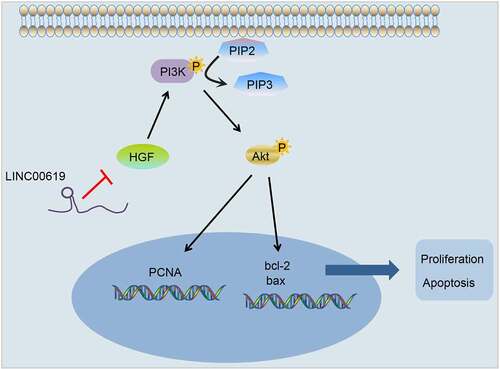
Figure 10. LncRNA LINC00619 downregulation of HGF inhibits proliferation, migration and invasion and increases apoptosis in osteosarcoma tumour cells via the PI3K-Akt pathway.
Supplemental Material
Download Zip (128.5 KB)Availability of data and materials
The datasets generated and/or analyzed during the current study are available from the corresponding author on reasonable request.