
Figures & data
Figure 1. Chromatin accessibility analysis using cell type-specific ATAC-seq assay in the mouse brain. a. Scheme of the ATAC-seq assay; three freezing conditions were used for mouse frontal cortex: slow freezing in a cryoprotective medium (MED), and flash freezing in either dry ice cooled hexane (HEX) or liquid nitrogen (LN2). Neuronal (NeuN+) nuclei were purified with FANS and used for the analysis. b. FRiP score shows fraction of reads in peaks as a QC measure of enrichment in all three conditions: MED, HEX, and LN2. c. Principal component analysis of the ATAC-seq duplicates for each condition (note a complete overlap of the two MED points). d. Venn diagrams show the number of open chromatin regions (ATAC-seq peaks) in each condition following the IDR analysis and their overlap. e. Distribution of the reproducible (IDR) peaks across the genome in each condition.
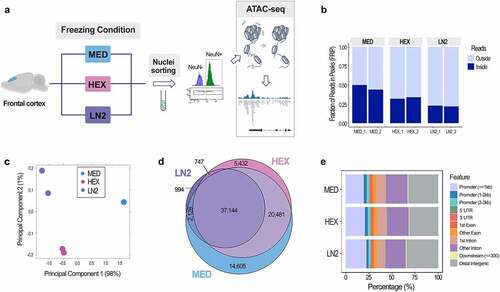
Figure 2. Chromatin signatures in neuronal cells of the mouse brain. ATAC-seq peak height (a) and Read number in MED-specific peaks (b) for MED, HEX, and LN2 condition. c. Average peak height in all MED peaks vs. MED-only peaks. Chromatin accessibility (ATAC-seq) profiles of Egr1 (d), Slc1a2 (e), Kcnv1 (f), and Cacna1c (g) in mouse cortical neuronal cells, shown in duplicates for each condition. Histone modification ChIP-seq tracks (H3K4me3, H3K27ac, H3K4me1, H3K27me3) for all four genes are derived from postnatal 0 day mouse forebrain bulk tissue, generated by the Mouse ENCODE project. MED neuronal nuclei, blue; HEX neuronal nuclei, pink; LN2 neuronal nuclei, purple; ENCODE bulk brain tissue, grey. Note: grey dashed boxes show putative enhancers and purple dashed boxes show promoters. The black arrow by each gene signifies the direction of transcription.
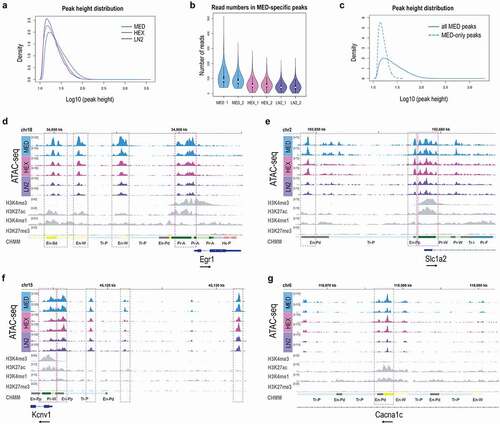
Figure 3. Gene ontology and KEGG pathway analysis of the mouse ATAC-seq data. a. Top ten GO terms for Biological process and Cellular component, and b. Top ten KEGG pathways in MED, HEX, and LN2 condition, with the MED condition used as a reference. Colours indicate adjusted p values and dot size corresponds to gene ratio.
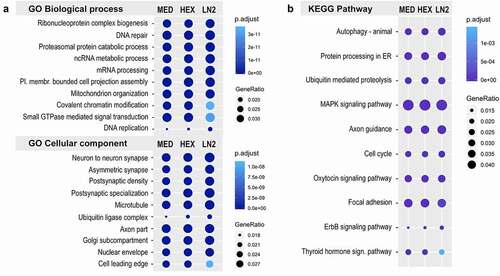
Figure 4. Motif analysis of the mouse ATAC-seq data. Dotplot shows top 20 transcription factor binding motifs in MED, HEX, and LN2 condition, with the MED condition used as a reference. Colours indicate log adjusted P values and dot size corresponds to percent target.
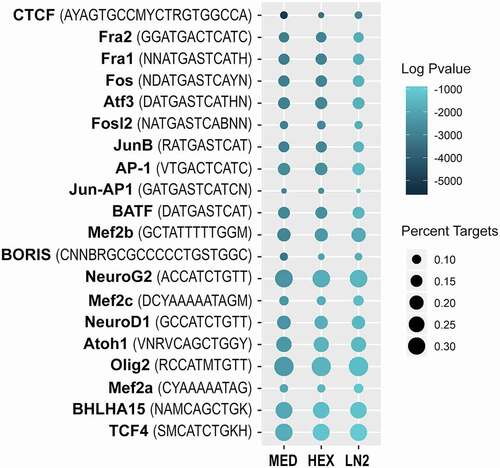
Figure 5. Chromatin accessibility analysis using cell type-specific ATAC-seq assay in post-mortem human brain. FRiP scores (a) and genomic peak distribution (b) of the ATAC-seq data generated from neuronal (NeuN+) nuclei of the two post-mortem human anterior cingulate cortices (Brodmann areas 24/32; Brains A and B). A/B IDR peaks, high confidence peaks generated by the IDR analysis, were then used for the GO Cellular component (c) and KEGG pathway (d) analyses. Colours indicate adjusted p values and dot size corresponds to gene count. Top 15 GO and top 10 KEGG pathways are shown. Motif analysis of the ATAC-seq data (e) shows top 25 transcription factor binding motifs. Colours indicate log adjusted P values and dot size corresponds to percent target.
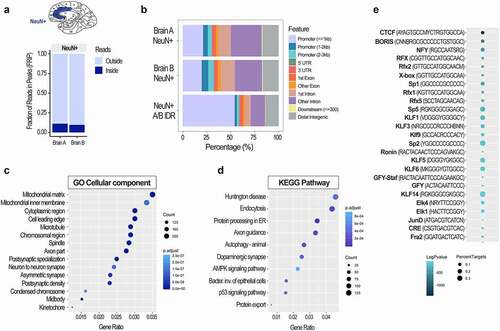
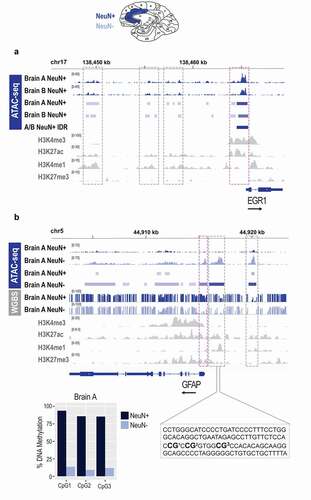
Figure 6. Epigenomic signatures of neuronal and non-neuronal cells in post-mortem human brain. a. Chromatin accessibility (ATAC-seq) profile of the EGR1 gene in neuronal (NeuN+) cells of the post-mortem human anterior cingulate cortex; bam and bed files are shown for each brain separately (a and b); the A/B IDR track represents a bed file of high confidence peaks generated by the IDR analysis. b. Chromatin accessibility (ATAC-seq) and DNA methylation (WGBS) profile of the GFAP gene in neuronal (NeuN+) and non-neuronal (NeuN-) cells of the post-mortem human anterior cingulate cortex; bam, bed, and bedgraph files are shown for both cell types; shown is also a focused DNA methylation analysis of the three CpG sites (bar graph) located in the proximal enhancer (dashed rectangle) using bisulphite pyrosequencing. Histone modification ChIP-seq tracks (H3K4me3, H3K27ac, H3K4me1, H3K27me3) for both genes are derived from the cingulate gyrus bulk tissue, generated by the NIH Roadmap Epigenomics project. Neuronal (NeuN+) nuclei, dark blue; Non-neuronal (NeuN-) nuclei, light blue; NIH Roadmap Epigenomics bulk brain tissue, grey. Note: grey dashed boxes show putative enhancers and purple dashed boxes show promoters. The black arrow by each gene signifies the direction of transcription.
Supplemental Material
Download Zip (23.3 MB)Data Availability
Mouse and human ATAC-seq data are available from the NCBI Gene Expression Omnibus database under accession number GSE154068. https://www.ncbi.nlm.nih.gov/geo/query/acc.cgi?acc=GSE154068
Human WGBS data are available from the NCBI Sequence Read Archive under accession number PRJNA645607 https://www.ncbi.nlm.nih.gov/bioproject/PRJNA645607