
Figures & data
Figure 1. Reduced MethylCap protein improves low-input methylation enrichment.
(a,b) Total normalized CpG islands coverage and CpG islands/shores/shelves coverage across different amounts of MethylCap protein and magnetic beads. (N = 4 for the first condition, N = 3 for other conditions. Mean with the standard error of the mean (SEM).) (c) Coverage by CpG density plot across different amounts of MethylCap protein and magnetic beads. Coverage is defined as the average number of fragments covering CpGs. The CpG density is the number of CpGs per fragment. (d) CpG density at peak and noise under different MethylCap proteins and magnetic beads. The CpG density at the peak is the CpG density at the point of highest coverage on the ‘coverage by CpG density plot’ (left y-axis). Noise is the ratio of average non-CpG coverage to average CpG coverage (right y-axis).
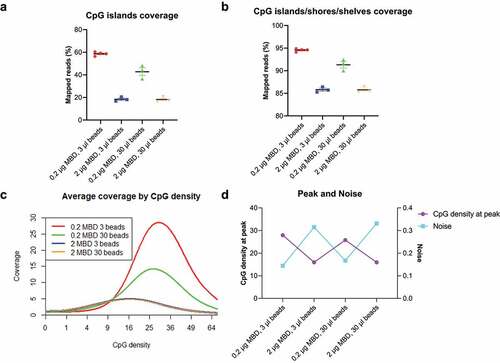
Figure 2. Methylated filler DNA is needed to compensate for low-input methylation enrichment.
(a,b) Total normalized CpG islands coverage and CpG islands/shores/shelves coverage across different methylation states of filler DNA. (N = 4 for the first condition, N = 3 for other conditions. Mean with SEM.) (c) Coverage by CpG density plots across different methylation states of filler DNA. (d) The CpG density at peak (left y-axis) and noise (right y-axis) at different methylation states of filler DNA.
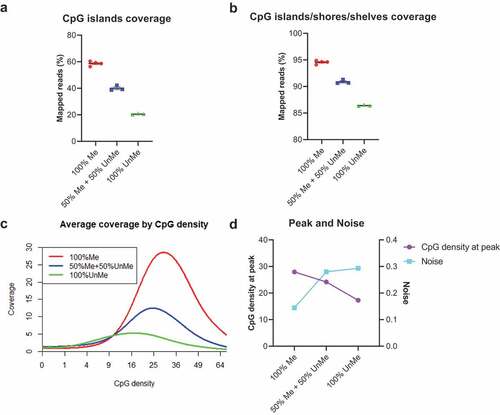
Figure 3. Different input DNA amounts in cfMBD-seq.
(a) Genome-wide Pearson correlations of normalized read counts between cfMBD-seq signal for 1–1000 ng of input HCT116 DNA (2 technical replicates per concentration). The input control is from an input library of a ChIP-seq study (ENCODE: ENCFF280GWX). Log transformed counts were used in the scatter plots. (b,c) Total normalized CpG islands coverage and CpG islands/shores/shelves coverage across different mixtures of cfDNA and filler DNA. (N = 4 for the first condition, N = 2 for other conditions. Mean with SEM.) (d) CpG density at peak (left y-axis) and noise (right y-axis) of different mixtures of cfDNA and filler DNA.
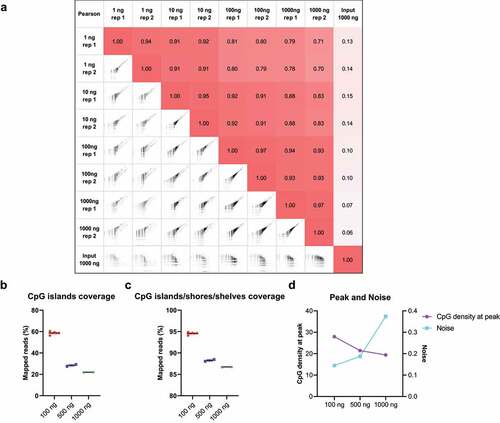
Figure 4. Comparison of cfMBD-seq with low input MBD-seq and cfMeDIP-seq.
(a) Receiver operating characteristic curve and corresponding area under the ROC curve for methylation status of CpG islands from Infinium HM450K data predicted by cfMBD-seq normalized read counts. (b,c) Total normalized CpG annotations coverage and CpG islands/shores/shelves coverage of cfMBD-seq (N = 8), cfMeDIP-seq (N = 24), and low-input MBD-seq (N = 4). (Mean with SEM.) (d) Coverage by CpG density plot of cfMBD-seq, cfMeDIP-seq, and low-input MBD-seq.
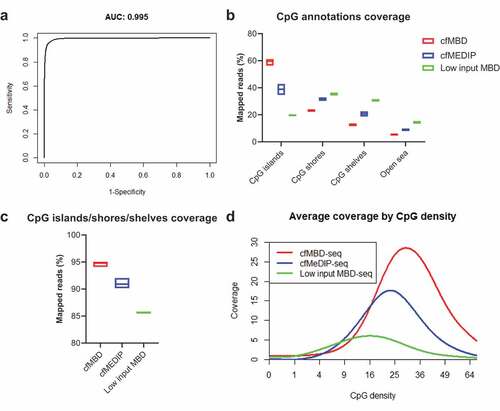
Table 1. Feature comparison among cfMBD-seq, low input MBD-seq, and cfMeDIP-seq
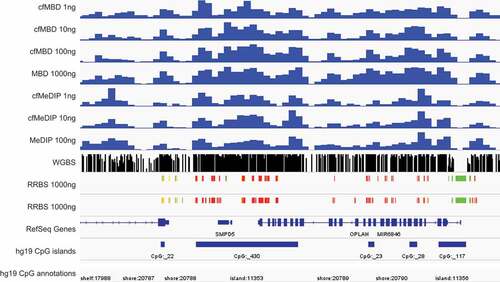
Figure 5. cfMBD-seq recapitulates methylation profiles from other technologies.
Genome Browser snapshot of HCT116 cfMBD-seq signal across chr8:145,095,942–145,116,942, at different starting DNA inputs (1 to 100 ng), compared with cfMeDIP-seq (Gene Expression Omnibus (GEO): GSE79838), RRBS (ENCODE: ENCSR000DFS), and WGBS (GEO: GSM1465024) data. For cfMBD-seq and cfMeDIP-seq, the y-axis indicates RPKMs normalized reads; for RRBS, red and green blocks represent hypermethylated and hypomethylated CpGs, respectively. For the WGBS track, peak heights indicate methylation levels.
Supplemental material
Supplemental Material
Download Zip (1.8 MB)Availability of materials and data
The sequencing data is available from GEO under the accession number GSE161331.
The data analysis pipeline is available at https://github.com/LiangWangLab/cfMBD-seq.