
Figures & data
Table 1. Descriptive characteristics of 1,207 MESA participants.
Table 2. Differentially methylated regions for PM2.5 and NOX with FDR<0.05.
Figure 1. Genome-wide significant differentially methylated region associated with PM2.5 located at chromosome 5 (location: 1,594,282–1,594,863). The top portion of this plot is a karyogram of chromosome 5, with a red vertical bar indicating the location of interest. Below that is a graphic showing the exact chromosomal location in Mb, followed by a pictogram of the SDHAP3 gene (hg19). Tan boxes represent exons (vertically narrow portions are untranslated regions), and grey lines with arrows represent introns, as well as the direction of transcription (arrows pointing to the left indicate that this gene is transcribed from right to left, implying it is on the minus strand). The bottom section presents evidence for differential methylation of a DMR (blue line), based on a cluster of 12 CpGs (blue dots). The vertical axis for this section reflects the PM2.5 coefficient from the linear model. Plots were generated by using the function makeMethPlot from the package methylation.
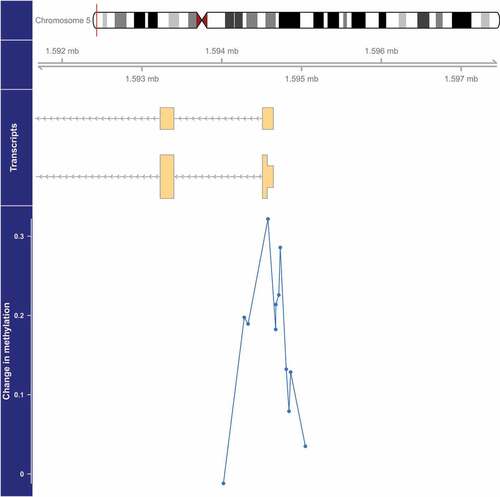
Figure 2. Genome-wide significant differentially methylated region associated with PM2.5 located at chromosome 6 (location: 29,648,379–29,649,024). The top portion of this plot is a karyogram of chromosome 6, with a red vertical bar indicating the location of interest. Below that is a graphic showing the exact chromosomal location in Mb (hg19). The bottom section presents evidence for differential methylation of a DMR (blue line), based on a cluster of 19 CpGs (blue dots). The vertical axis for this section reflects the PM2.5 coefficient from the linear model. Plots were generated by using the function makeMethPlot from the package methylation.
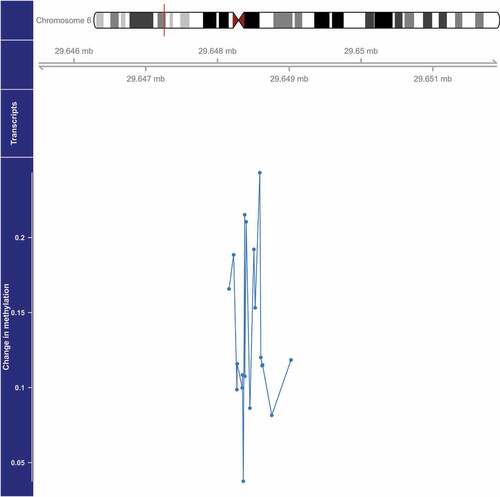
Figure 3. Genome-wide significant differentially methylated region associated with PM2.5 located at chromosome 16 (location: 11,374,865–11,374,865). The top portion of this plot is a karyogram of chromosome 16, with a red vertical bar indicating the location of interest. Below that is a graphic showing the exact chromosomal location in Mb, followed by a pictogram of the PRM1 gene (hg19). Tan boxes represent exons (vertically narrow portions are untranslated regions), and grey lines with arrows represent introns, as well as the direction of transcription (arrows pointing to the left indicate that this gene is transcribed from right to left, implying it is on the minus strand). The bottom section presents evidence for differential methylation of a DMR (blue line), based on a cluster of 5 CpGs (blue dots). The vertical axis for this section reflects the PM2.5 coefficient from the linear model. Plots were generated by using the function makeMethPlot from the package methylation.
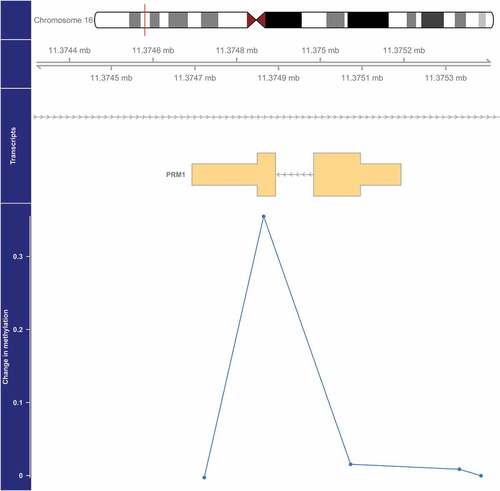
Figure 4. Genome-wide significant differentially methylated region associated with PM2.5 located at chromosome 7 (location: 27,183,274–27,184,109). The top portion of this plot is a karyogram of chromosome 7, with a red vertical bar indicating the location of interest. Below that is a graphic showing the exact chromosomal location in Mb, followed by pictograms of the HOXA5, HOXA6, and HOXA-AS3 genes (hg19). Tan boxes represent exons (vertically narrow portions are untranslated regions), and grey lines with arrows represent introns, as well as the direction of transcription (arrows pointing to the left indicate that this gene is transcribed from right to left, implying it is on the minus strand, and vice versa for arrows point to the right). The bottom section presents evidence for differential methylation of a DMR (blue line), based on a cluster of 47 CpGs (blue dots). The vertical axis for this section reflects the PM2.5 coefficient from the linear model. Plots were generated by using the function makeMethPlot from the package methylation.
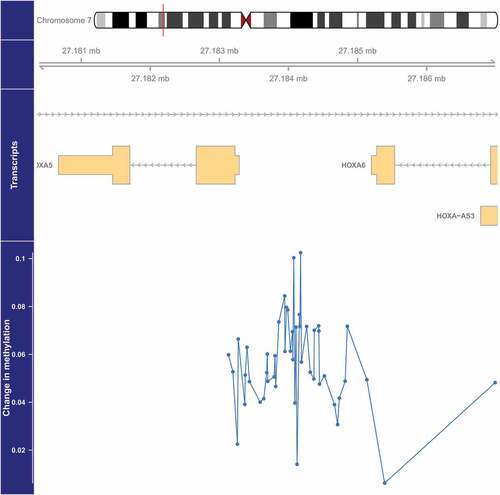
Table 3. Significant (FDR<0.05) associations between methylation of PM2.5-associated DMRs and mRNA expression of nearby genes.
Table 4. Differentially methylated sites for PM2.5 and NOX with FDR<0.05.
Table 5. Significant (FDR<0.05) associations between cg05926640 methylation and mRNA expression of nearby genes.