
Figures & data
Table 1. Characteristics of the reduced representative genome and comparisons with the genome
Figure 1. Hepatic DNA methylation landscape in K. marmoratus . (a) Frequency distribution of MSPI fragment size. Mean fragment size was 95 bp and median 88 bp; (b) Overall distribution of analysed fragments in genomic elements; (c:)) Frequency distribution of DNA methylation % for MSPI fragments. Distribution of MSPI fragments follows a bimodal distribution, which is expected given the binary character of DNA methylation in cells; (d) Boxplot of DNA methylation (%) of fragments according to their location in genomic elements (including medians and quantile 25–75%).
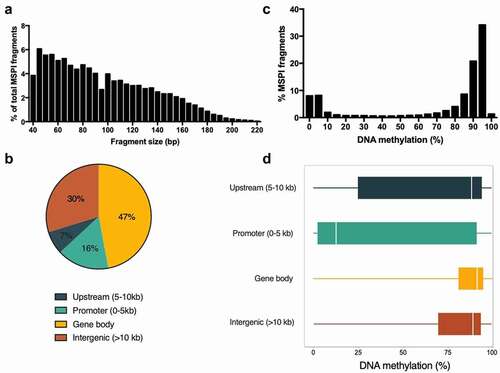
Figure 2. Distribution of lowly methylated (<20% methylation) (a) and highly methylated (> 80% methylation) (b) fragments among the genomic regions (gene body, promoter, upstream, intergenic) of the liver reduced representative genome of the mangrove rivulus.
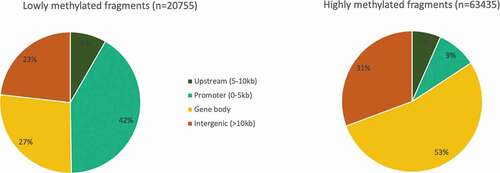
Table 2. Number of analysed fragments, analysed CpGs and number of DMFs in each group comparison
Table 3. Differentially methylated fragments (DMFs) between 4 ng/L EE2 and control individuals. Methylation difference represents the mean methylation at 4 ng/L minus the mean methylation in controls. Fragments discussed in the text are marked with *
Table 4. Differentially methylated fragments (DMFs) between 120 ng/L EE2 and control individuals. Methylation difference represents the mean methylation at 120 ng/L minus the mean methylation in controls. Fragments discussed in the text are marked with *
Table 5. Differentially methylated fragments (DMFs) between 120 ng/L EE2 and 4 ng/L EE2 exposed individuals. Methylation difference represents the mean methylation at 120 ng/L minus the mean methylation at 4 ng/L. Fragments discussed in the text are marked with *
Figure 3. (a) Volcano plot representations of significance and differential methylation in analysed fragments. Dotted lines represent thresholds of significance: −10LogP20, corresponding to P0.01 and mean methylation difference 10% (a) 4 ng/L vs control; B:120 ng/L vs control; C: 4 ng/L vs 120 ng/L. (b) Overall distribution of DMFs in genomic elements; (c) Venn Diagram showing specific and common DMFs between group comparisons; (d) Methylation levels (%) of common fragments between 4 vs Ctl and 120 vs Ctl comparisons (Da,Db), between 4 vs Ctl and 4 vs 120 comparisons (c–e) and between 120 vs Ctl and 4 vs 120 ng/L comparisons (f). For clearer representation of methylation differences, y axes start at 40%.
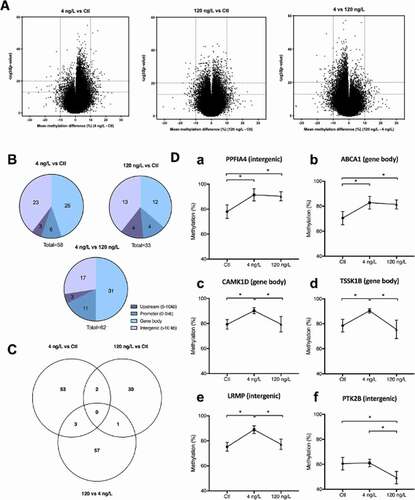
Table 6. Top molecular networks and functions associated with our dataset. Only differentially methylated fragments situated in promoter or gene body and their corresponding annotated genes were taken into account
Figure 4. Network of genes corresponding to significant DMFs (located in promoter region or in gene body) at 4 ng/L compared to control. Blue: hypermethylation at 4 ng/L compared to control, Yellow: hypomethylation at 4 ng/L compared to control.
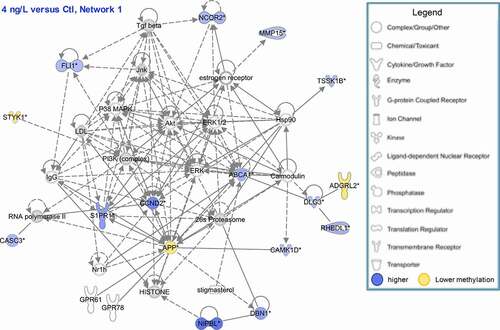
Table 7. DNA methylation levels of fragments related to genes involved in growth, steroidogenesis or reproduction