
Figures & data
Table 1. Baseline characteristics of the 23 NSCLC patients.
Table 2. Parameter estimates of cfDNA concentration in the urine of NSCLC patients measured across the different sampling time points according to the fitted linear mixed model corrected for sex.
Figure 1. Logarithmic representation of cfDNA concentrations (ng/mL urine) measured at different collection time points, illustrating the median and IQR of each collection time point. Outliers are indicated by bold circles located outside the whiskers of the boxplot. No significant differences were found within or between the days. cfDNA = cell-free DNA; IQR = interquartile range.
Figure 2. Conditional scatterplots displaying the between- and within-subject variability of the urinary cfDNA concentration of each NSCLC patient across the six sampled time points (m = morning, a = afternoon e = evening), stratified by sex (pink square = female, blue circle = male). cfDNA = cell-free DNA; NSCLC = non-small cell lung cancer.
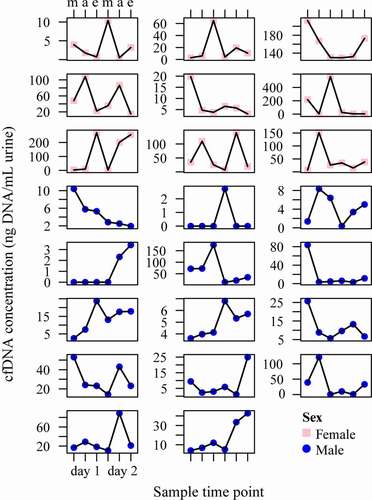
Table 3. Parameter estimates of DNA methylation levels of CDO1, SOX17 and TAC1 measured over time in urine samples of NSCLC patients according to the fitted linear mixed model.
Figure 3. Methylation levels of CDO1 (a), SOX17 (b), and TAC1 (c) measured in the urine of NSCLC patients at different collection time points illustrating the median and IQR of each collection moment. Methylation levels are normalized according to the reference gene ACTB and presented as square root Ct ratios. No significant differences were found within or between the days. IQR = interquartile range; NSCLC = non-small cell lung cancer.
Figure 4. Conditional scatterplots displaying the between- and within-subject variability of CDO1 (a), SOX17 (b), and TAC1 (c) methylation levels of each patient across the six sampled time points (m = morning, a = afternoon e = evening), stratified by sex (pink square = female, blue circle = male). Missing data points indicate excluded urine samples with an ACTB value of ≥ 32.
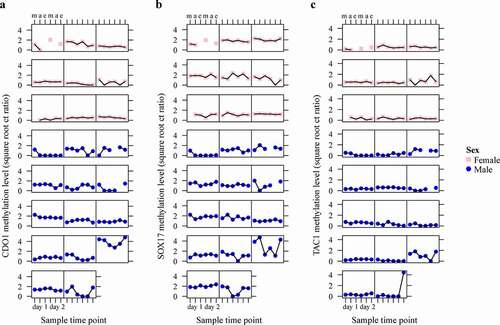
Figure 5. Methylation levels of CDO1 (a), SOX17 (b), and TAC1 (c) measured in the urine of NSCLC patients (n=23) and healthy controls (n=60). Methylation levels are normalised to the reference gene ACTB and presented as square root Ct ratios. Case values represent the mean methylation level measured in the six collected urine samples. Outliers are indicated by bold circles located outside the whiskers of the boxplot. *p < 0.10 (suggestive evidence), **p < 0.05 (moderate evidence).
Table 4. Statistical differences of CDO1, SOX17 and TAC1 methylation levels between NSCLC patients (n=23) and healthy controls (n=60) when collecting one or six urine samples per patient.