
Figures & data
Table 1. PRISM participant characteristics by tissue and associations with infant sex.
Table 2. Summary of differentially methylation regions (DMRs) and positions (DMPs) associated with infant sex. DMRs identified using DMRcate with the FDR cut-off = 0.01, λ = 1,000, and the minimum number of CpGs = 10. DMPs identified using limma applied to M-values. All models adjusted for cellular heterogeneity using ReFactor components.
Table 3. Ranking of top-10 DMRs associated with infant sex. DMRs identified using DMRcate modelling females vs. males adjusting for ReFactor components with the FDR cut-off = 0.01, λ = 1,000, and the minimum number of CpGs = 10. DMRs ordered by Fisher combined probability transform of the individual CpG FDRs.
Figure 1. Overlap between DMRs in cord blood, placenta, and artery samples associated with infant sex. DMRs identified using DMRcate modelling females vs. males and adjusting for ReFactor components with the FDR cut-off = 0.01, λ = 1,000, and the minimum number of CpGs = 10. DMRs with consistently higher mean methylation among females are represented in Orange, DMRs with consistently higher mean methylation among males are represented in purple, and DMRs with different mean directions of association between tissues are represented in grey. Mean differences in % methylation for each DMR are displayed in the scatter plot. Cord blood: N = 179; placenta: N = 229; artery: N = 229.
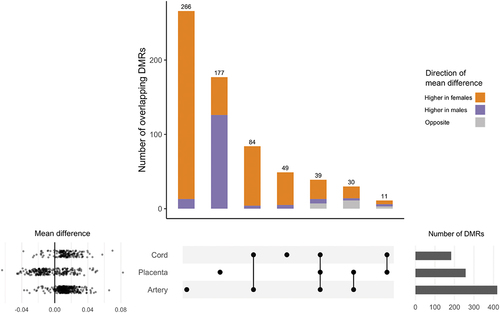
Table 4. Overlapping differentially methylated regions (DMRs) associated with infant sex in cord blood, placenta, and artery samples. DMRs identified using DMRcate modelling females vs. males adjusting for ReFactor components with the FDR cut-off = 0.01, λ = 1,000, and the minimum number of CpGs = 10. DMRs ordered by chromosomal coordinate.
Figure 2. Scatter plot of DMR chr6: 28,601,269–28,601,519.
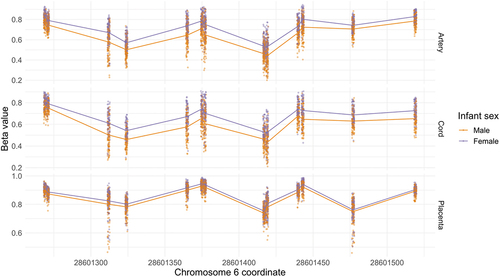
Table 5. Summary of Gene Ontology (GO) analyses of differentially methylated regions (DMRs) and positions (DMPs). One, 3, and 39 GO terms were identified with an overrepresentation of DMRs associated with infant sex in cord blood, placenta, and artery samples, respectively (pFDR < 0.05). Twenty-eight and 9 GO terms were identified with an overrepresentation of DMPs associated with infant sex in cord blood in placenta and artery samples, respectively (pFDR < 0.05). No GO terms were associated to infant sex in cord blood (pFDR > 0.05). Closely related GO terms have been combined; for a complete list of sex-associated GO terms, see Supplemental Tables S2 and S4.
Table 6. Top-10 DMPs associated with infant sex ranked by p-value. DMPs identified using limma applied to M-values modelling females vs. males and adjusting for ReFactor components. Effect size estimates from limma applied to Beta-values. Bolded CpGs were identified in more than one tissue.
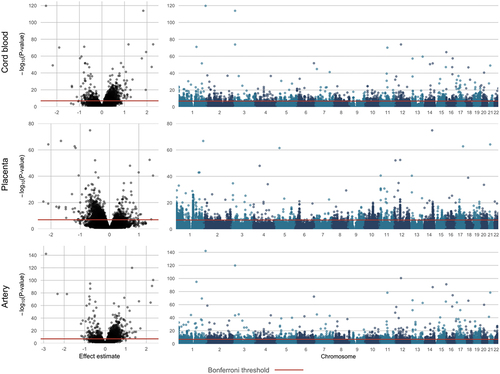
Figure 3. Volcano and Manhattan plots for DMPs associated with infant sex.
Supplemental Material
Download Zip (1.2 MB)Data Availability
R script for analysis of replication analyses using GEO Accession GSE129841 is available at https://github.com/annebozack/GEO_infant_sex_rep_analysis. Additional data available upon request to the corresponding author.