Figures & data
Figure 1. Flowchart of the protocols used.
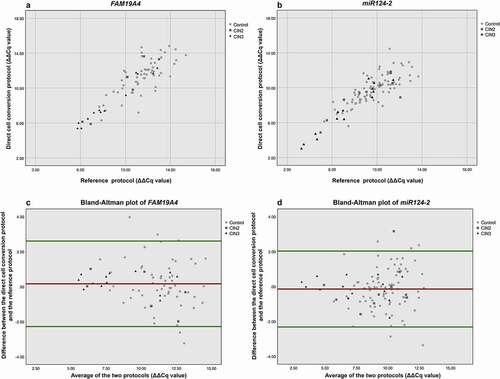
Figure 2. Correlation of ΔΔCq values of FAM19A4 (a) and miR124-2 (b) between direct cell conversion and reference protocol. For both x- and y-axis: a lower ΔΔCq value represents a higher methylation value. Bland–Altman plot for FAM19A4 (c) and miR124-2 (d). The horizontal red line shows the mean of the difference in ΔΔCq value (=bias) between the two protocols, being 0.167 for FAM19A4 and −0.142 for miR124-2. The horizontal green lines show the upper and lower 95% limits of agreement (= bias ±1.96 × SD), being −2.274 and +2.608, respectively, for FAM19A4 and −2.316 and +2.031, respectively, for miR124-2.