Figures & data
Figure 1. The overview of study design. (a) Design of the study. (b) Gene and CpG pairs (GCPs) are defined as CpG sites located within the 10kb flanking region of the corresponding gene.
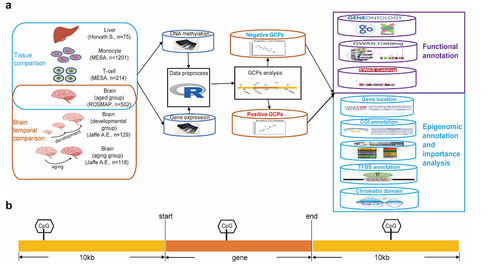
Table 1. Summary of significantly correlated GCPs (BH-adjusted p-value <0.05) in each tissue. GCPs, gene and CpG pairs; cGCPs, correlated GCPs; ncGCPs, negatively correlated GCPs; pcGCPs, positively correlated GCPs.
Figure 2. cGCPs are tissue-specific and the cGenes are enriched in tissue-specific functions. (a) The Venn plot to compare negatively correlated GCPs (ncGCPs) across four tissues. Brain, aged brain. (b) The Venn plot to compare positively correlate GCPs (pcGCPs) across four tissues. (c) The top-ranked GO enrichment items for cGenes across four tissues. The number in parenthesis under tissue name refers to cGCPs count. Mono, monocytes.
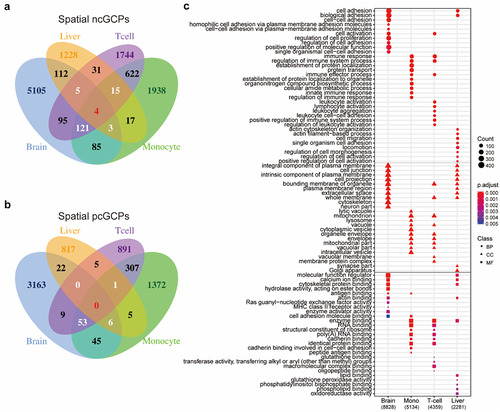
Figure 3. An example of cGCPs shared across four tissues. Scatter plots of GSTT1 expression level (X-axis) and cg04234412 methylation level (Y-axis) in the aged brain (a), liver (b), monocyte (c), and T-cell (d). Brain, aged brain.
Figure 4. cGCPs in the brain are development-specific and cGenes in the developmental brain are enriched for neurogenesis and neuron differentiation. (a) The Venn plot to compare ncGCPs across the developmental, ageing, and aged brain. devBrain, brain developmental group; agingBrain, brain ageing group; agedBrain, brain aged group. (b) The Venn plot to compare pcGCPs across the developmental, ageing, and aged brain. (c) Comparison of the top-ranked GO enrichment items for cGCPs between the developmental brain and aged brain. The number in parenthesis under stage name refers to cGCPs count.
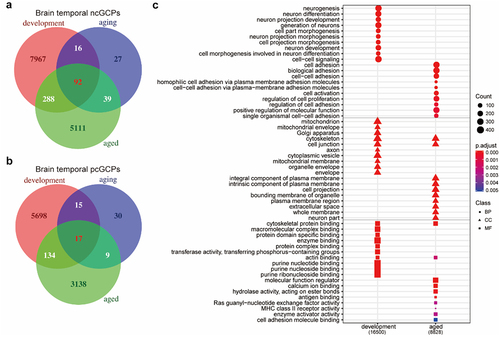
Figure 5. cGenes of specific tissue types are enriched in GWAS of the most relevant phenotype. (a) Top-ranked overrepresented GWAS catalogue gene sets in cGCPs across different tissues and brain stages. agedBrain, brain aged group; devBrain, brain developmental group; agingBrain, brain ageing group. (b-g) Examples of schizophrenia-related cGCPs in the aged brain developmental brain, and/or ageing brain.
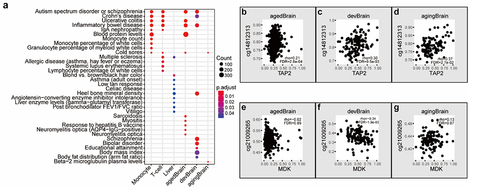
Figure 6. ncCpGs and pcCpGs are associated with multiple specific epigenomic features. (a) The bar plot for CpGs by location relative to CpG islands (CGI). The stars (*) represent significant enrichment in the hypergeometric test (p-value<0.05). agedBrain, brain aged group; devBrain, brain developmental group; agingBrain, brain ageing group. (b) The bar plot for CpGs by location relative to gene body of the matched genes. The stars (*) represent significant enrichment in the hypergeometric test (p-value<0.05). (c) Overrepresentation of 15 epigenetic states in cGCPs. The active states are labelled as red colour and the repressive states are labelled as blue colour. (d) Overrepresentation of histone modification and DHS regions in cGCPs. The active markers are labelled as red and the repressive markers are labelled as blue. The markers which are not available are labelled as grey. (e) Overrepresentation of TF binding regions in ncGCPs and pcGCPs, respectively. The stars (*) represent significant enrichment in Fisher’s exact test (q value<0.1). (f) The feature importance for ncGCPs and pcGCPs, respectively.
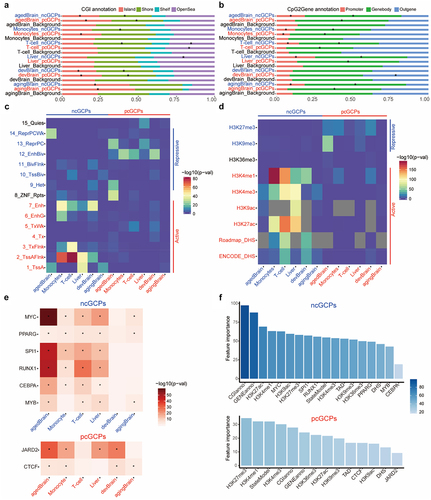
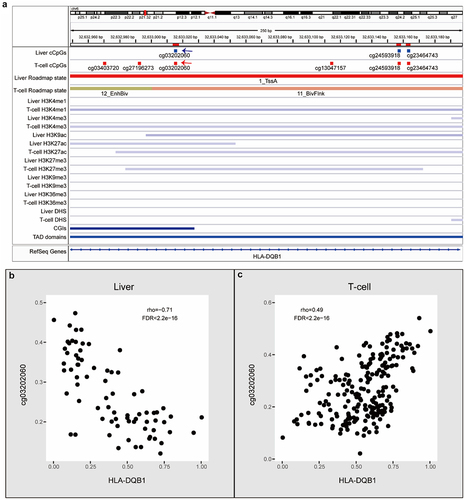
Figure 7. Examples of cGCPs with opposite correlations in liver or T-cells. (a) An IGV plot shows cCpGs of HLA-DQB1 and epigenomic features. cCpGs in blue and red mean negative and positive correlations, respectively. The blue and red arrows point the examples of negative and positive cCpGs. (b) Scatter plots of HLA-DQB1 expression level (X-axis) and cg03202060 methylation level (Y-axis) in the liver. (c) Scatter plots of HLA-DQB1 expression level (X-axis) and cg03202060 methylation level (Y-axis) in the T-cell.