Figures & data
Figure 1. EM-seq libraries performed better in regards to library and sequencing quality. (a) Samples from two individuals (yellow and green) were collected and split into two for EM-seq and PBAT libraries, respectively. Each method included 1, 2, 5 and 10ng input amounts. (b) Stacked bar plots illustrate unique (green), ambiguous (yellow) and no (orange) alignment based on % reads. (c) Illustration of unique (dark turquoise) and duplicate (yellow) reads. (d) Complexity curves of EM-seq (blue) and PBAT (red) library methods. The dashed grey line illustrates maximum library complexity.
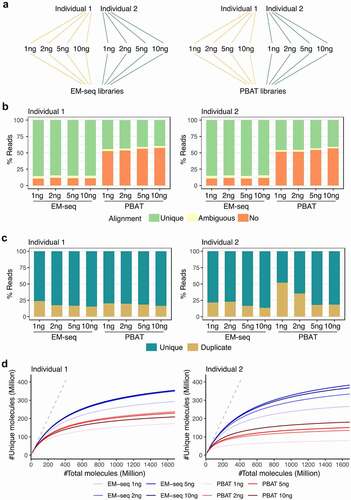
Figure 2. CpG coverage and overlap. (a) Number of CpG sites and sequencing coverage in EM-seq (blue) and PBAT (red) for all input amounts for individual 1 encompassing whole genome and genomic features such as CpG islands, CTCF binding sites, enhancers, open chromatin, promoters, transcript factor (TF) binding sites and gene regions. (b) Overlap (purple) of EM-seq (blue) and PBAT (red) CpG sites from input amounts of 1, 2, 5 and 10ng in individual 1. M (million) for whole genome and gene region, K (thousand) for other features.
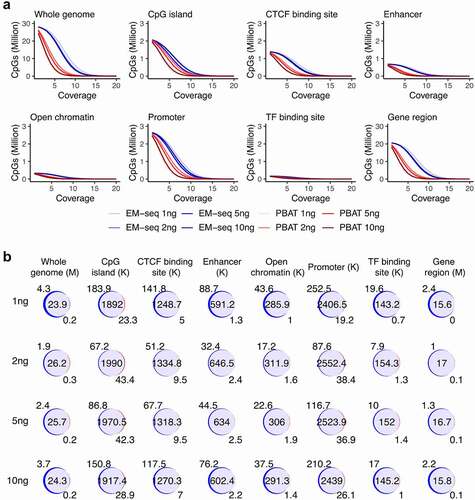
Figure 3. Landscapes of DNA methylation levels within genomic features. Illustration of methylation levels around CTCF binding site regions, enhancers, open chromatin, promoters, TF binding regions, and gene region from TSS to TES. EM-seq libraries are illustrated in blue and PBAT in red for different input amounts (1, 2, 5 and 10ng) in individual 1. CpGs with at least 5X were considered.
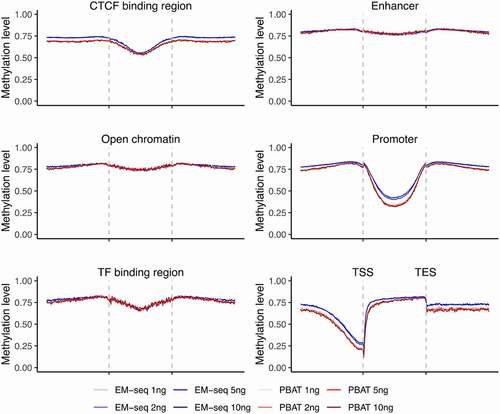
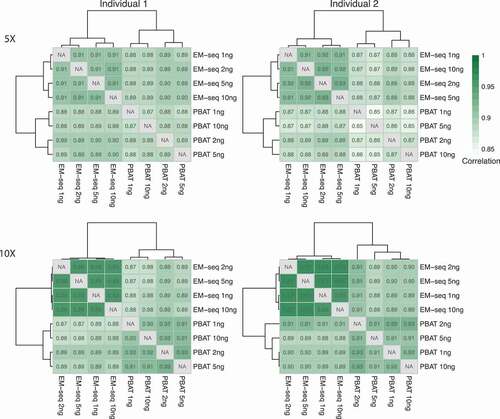
Figure 4. Correlation of DNA methylation levels. Heatmaps illustrating Pearson’s correlation coefficients between input amounts (1, 2, 5 and 10ng) and library methods (EM-seq and PBAT). CpGs covered by at least 5X and 10X were considered.