
Figures & data
Table 1. Thermal profile of MS-MLPA PCR.
Table 2. Protocol for MS-HRM analysis of the CADM1 amplicon.
Figure 1. MS-MLPA results of DNA methylation: A) heat map representing the methylation profile of selected tumour suppressor genes in the analysed samples (% of methylation) and B) promoter hypermethylation of 25 studied tumour suppressor genes (% of methylated samples).
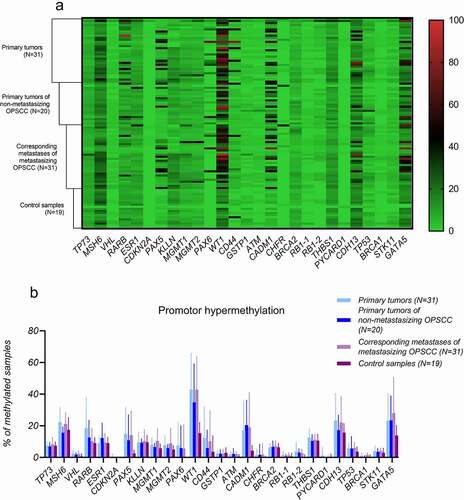
Table 3. Clinicopathological data versus count of methylated samples based on MS-MLPA results.
Figure 2. Kaplan-Meier survival plot showing overall survival of the OPSCC patients with methylated or unmethylated gene based on MS-MLPA results.
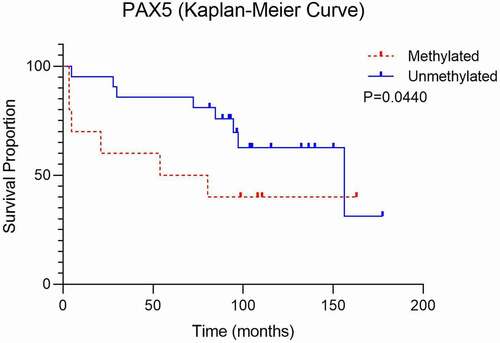
Figure 3. Representative plots from MS-HRM of CADM1 gene. Plots show curves of standards (100% red, 10% orange, unmethylated template green), methylated sample (purple), and unmethylated sample (blue).
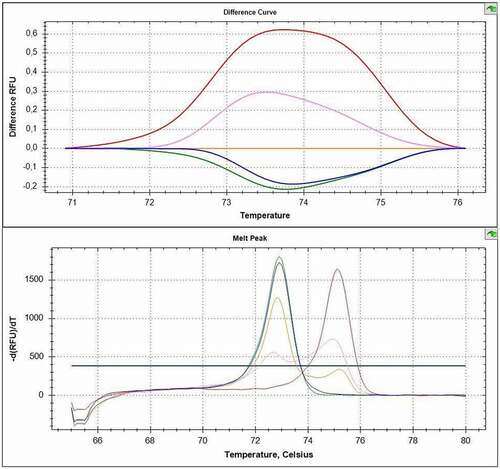
Table 4. CADM1 hypermethylation and prevalence of HPV in studied groups using MS-HRM.
Data Availability Statement
The authors confirm that the data supporting the findings of this study are available within the article.