
Figures & data
Table 1. Description of the cohort.
Table 2. Top significant differentially methylated positions associated with Multiple Sclerosis in glial nuclei.
Figure 1. DNA methylation changes in non-neuronal nuclei of Multiple Sclerosis patients. a. Circos plot illustrating differentially methylated positions (DMPs) in non-neuronal nuclei of the normal appearing white matter of Multiple Sclerosis (MS) compared to white matter of non-neurological controls (NNC). The outer track is a hg19 ideogram illustrating chromosome and cytoband information. The upper track represents the corresponding -log10 (P-values), with dark red indicating sites passing significance threshold of Benjamini-Hochberg-adjusted P-value, Padj < 0.05 and light red illustrating CpGs with P < 0.001. The inner track corresponds to the effect size of DNA methylation changes (Δβ-value) between MS and NNC, with red and blue depicting hyper- and hypomethylation, respectively. b Heatmap of the DMPs (Padj < 0.05) with red and blue depicting z-score transformed hyper- and hypomethylation, respectively. c. Distribution of DMPs (Padj < 0.05) across classical gene features including promoter-like features (TSS1500, TSS200, 1stExon, 5′UTR), gene body and 3′UTR (shades of green) and CpG Island (CGI)-related features including CpGs Islands, shores, shelves and open sea (shades of orange). Violin plots and barplot depict β-values (with the mean coloured in red) and DMPs distribution (in comparison to EPIC background), respectively. *P < 0.05, **P < 0.001 using Fisher’s exact test for enrichment and depletion analyses. All DMPs are listed in Supplementary Table 2.
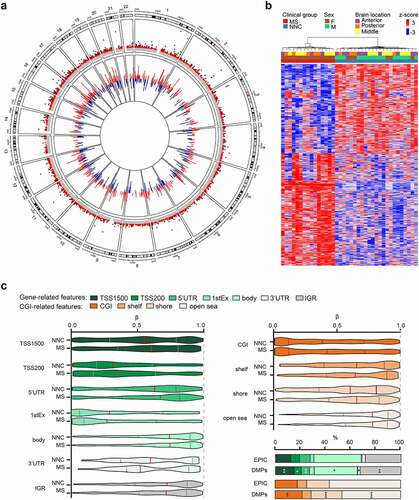
Table 3. Gene ontology analysis of differentially methylated genes (DMP with Padj < 0.05) associated with Multiple Sclerosis in glial nuclei.
Figure 2. Functional annotation of DNA methylation changes associated with Multiple Sclerosis. a. Scattered plot showing clusters of gene ontology (GO) terms associated with differentially methylated genes (DMP with Padj < 0.05) in glial nuclei of MS patients compared to NNC. Biological processes GO terms were obtained using over-representation analysis and clusters were visualized in two-dimensional space (assigning x and y coordinates to each term) by applying multidimensional scaling of the matrix of GO terms according to pairwise semantic similarity, using REVIGO [Citation54]. The circle size represents −log10 (P-value), with small to big diameters ranging from 2.07 (P = 8 × 10−03) to 5.44 (P = 3 × 10−06). Top GO terms associated to different categories of Biological processes are presented in the right panel. b. Representation of the genes containing DMPs (Padj < 0.05) involved in the biological processes using STRING network analysis. Colours represent different clusters (kmeans clustering set at 5 clusters). Grey gradient indicated the strength of data support (darker grey representing stronger evidence, dotted line showing lower level of evidence, i.e., combined interaction score 0.4–0.6). Full GO data are presented in Supplementary Table 5.
![Figure 2. Functional annotation of DNA methylation changes associated with Multiple Sclerosis. a. Scattered plot showing clusters of gene ontology (GO) terms associated with differentially methylated genes (DMP with Padj < 0.05) in glial nuclei of MS patients compared to NNC. Biological processes GO terms were obtained using over-representation analysis and clusters were visualized in two-dimensional space (assigning x and y coordinates to each term) by applying multidimensional scaling of the matrix of GO terms according to pairwise semantic similarity, using REVIGO [Citation54]. The circle size represents −log10 (P-value), with small to big diameters ranging from 2.07 (P = 8 × 10−03) to 5.44 (P = 3 × 10−06). Top GO terms associated to different categories of Biological processes are presented in the right panel. b. Representation of the genes containing DMPs (Padj < 0.05) involved in the biological processes using STRING network analysis. Colours represent different clusters (kmeans clustering set at 5 clusters). Grey gradient indicated the strength of data support (darker grey representing stronger evidence, dotted line showing lower level of evidence, i.e., combined interaction score 0.4–0.6). Full GO data are presented in Supplementary Table 5.](/cms/asset/b88937f4-3151-4d15-8718-5a83e7345c1d/kepi_a_2020436_f0002_oc.jpg)
Figure 3. Differentially methylated regions in non-neuronal nuclei of Multiple Sclerosis patients. Plots illustrating genes associated with differentially methylated regions (DMRs) identified in glial nuclei from Multiple Sclerosis (MS) cases compared to non-neurological controls (NNC). UCSC genome browser annotations are shown: the hg19 ideogram illustrating chromosome and cytoband information, the complete gene structure of the locus (blue track), CpG Island (CGI) when present (green track), DNAseI hypersensitivity and transcription factor (TF) binding clusters (grey gradient) as well as other regulatory properties exemplified in cell lines from chromatin state segmentation by hidden Markov model from ENCODE/Broad with the following colour coding for active promoter (dark red), weak promoter (light red), poised promoter (purple), strong/weak enhancer (orange/yellow), insulator (blue), strong/weak transcription (dark/light green) and strong/weak heterochromatin (dark/light grey). The DMR (black) location appears in the last track. Methylation (β-values) of single consecutive CpGs within the DMR for cases and controls is depicted in red and blue, respectively, with connecting lines indicating mean methylation ± SEM. All DMRs are listed in Supplementary Table 3.
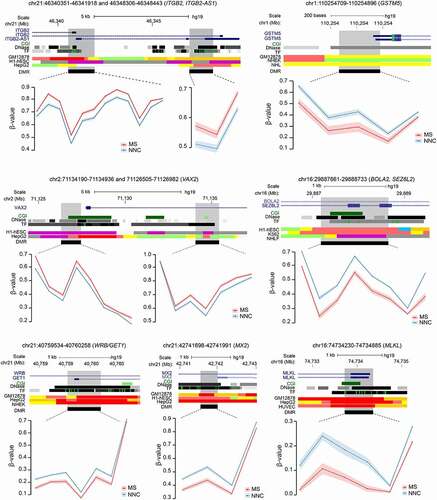
Figure 4. Association of DNA methylation changes with gene expression in the normal appearing white matter of Multiple Sclerosis patients. Scatterplot illustrating association of DMPs (Padj < 0.05) methylation values (Δβ) in glial nuclei samples with gene expression data (RNA-seq) reported in bulk NAWM of Multiple Sclerosis (MS) patients compared to WM of non-neurological controls (NNC) [Citation34]. Red and blue colours indicate upregulation and downregulation, respectively, in MS versus NNC bulk brain tissue. The barplot represents the proportions (percentage) of upregulated (red) and downregulated (blue) genes for all gene-annotated DMPs and DMPs located in promoter (TSS1500, TSS200) or gene body. The dotted line indicating the expected proportion * P < 0.05 generated with the Chi-square test. logFC, log2-fold change, Δβ, difference in the beta-value.
![Figure 4. Association of DNA methylation changes with gene expression in the normal appearing white matter of Multiple Sclerosis patients. Scatterplot illustrating association of DMPs (Padj < 0.05) methylation values (Δβ) in glial nuclei samples with gene expression data (RNA-seq) reported in bulk NAWM of Multiple Sclerosis (MS) patients compared to WM of non-neurological controls (NNC) [Citation34]. Red and blue colours indicate upregulation and downregulation, respectively, in MS versus NNC bulk brain tissue. The barplot represents the proportions (percentage) of upregulated (red) and downregulated (blue) genes for all gene-annotated DMPs and DMPs located in promoter (TSS1500, TSS200) or gene body. The dotted line indicating the expected proportion * P < 0.05 generated with the Chi-square test. logFC, log2-fold change, Δβ, difference in the beta-value.](/cms/asset/441253cd-ad89-4417-acf9-73522fb1b0ea/kepi_a_2020436_f0004_oc.jpg)
Figure 5. Cell type-specific functional association of DNA methylation changes in glial cells of Multiple Sclerosis patients. a. Heatmap of significant GO terms related to Biological Processes (min 3 molecules) generated from genes that associate with cell type-annotated DMPs. GO terms were grouped into clusters using the relative risk (RR) between different pathways, which was calculated based on the number of overlapping genes per pathway [Citation55]. The left panel reflects relative distance between GO terms and clusters. b. Significantly enriched biological processes shared by at least 2 out of 3 cell types. c. Scattered plot showing clusters of gene ontology (GO) terms associated with differentially methylated genes (DMP with Padj < 0.05) in MS patients compared to NNC, annotated as expressed in astrocytes (left), microglial cells (middle) and oligodendrocyte (right). Biological Processes GO terms were obtained using over-representation analysis and clusters were visualized in two-dimensional space (assigning x and y coordinates to each term) by applying multidimensional scaling of the matrix of GO terms according to semantic similarity, using REVIGO [Citation54]. The circle size represents −log10 (P-value), with small to big diameters ranging from 1.32 (P = 0.04) to 4.2 (P= 6.5 × 10−05). The top biological processes are displayed in the lower panel. d. Representation of the cell type-restricted genes containing DMPs (Padj < 0.05) involved in the top 50 biological processes from GO analysis in astrocytes (green), microglia (purple) and oligodendrocytes (orange), using STRING network analysis. Grey gradient indicated the strength of data support (darker grey representing stronger evidence, dotted line showing lower level of evidence, i.e., combined interaction score 0.4–0.6). Full GO data are presented in Supplementary Table 5. Astrocytes, microglial cells and oligodendrocyte are depicted in green, purple and orange, respectively.
![Figure 5. Cell type-specific functional association of DNA methylation changes in glial cells of Multiple Sclerosis patients. a. Heatmap of significant GO terms related to Biological Processes (min 3 molecules) generated from genes that associate with cell type-annotated DMPs. GO terms were grouped into clusters using the relative risk (RR) between different pathways, which was calculated based on the number of overlapping genes per pathway [Citation55]. The left panel reflects relative distance between GO terms and clusters. b. Significantly enriched biological processes shared by at least 2 out of 3 cell types. c. Scattered plot showing clusters of gene ontology (GO) terms associated with differentially methylated genes (DMP with Padj < 0.05) in MS patients compared to NNC, annotated as expressed in astrocytes (left), microglial cells (middle) and oligodendrocyte (right). Biological Processes GO terms were obtained using over-representation analysis and clusters were visualized in two-dimensional space (assigning x and y coordinates to each term) by applying multidimensional scaling of the matrix of GO terms according to semantic similarity, using REVIGO [Citation54]. The circle size represents −log10 (P-value), with small to big diameters ranging from 1.32 (P = 0.04) to 4.2 (P= 6.5 × 10−05). The top biological processes are displayed in the lower panel. d. Representation of the cell type-restricted genes containing DMPs (Padj < 0.05) involved in the top 50 biological processes from GO analysis in astrocytes (green), microglia (purple) and oligodendrocytes (orange), using STRING network analysis. Grey gradient indicated the strength of data support (darker grey representing stronger evidence, dotted line showing lower level of evidence, i.e., combined interaction score 0.4–0.6). Full GO data are presented in Supplementary Table 5. Astrocytes, microglial cells and oligodendrocyte are depicted in green, purple and orange, respectively.](/cms/asset/3e7946cb-a287-4443-84d0-8897cde822c9/kepi_a_2020436_f0005_oc.jpg)