
Figures & data
Table 1. Child characteristics by top tertile liver fat content (PDFF).
Table 2. Imaging characteristics of children by top tertile liver fat content (PDFF).
Table 3. Significant DMR associated with top tertile liver fat content (by MRI-PDFF).
Figure 1. Ingenuity pathway analysis. Top 30 Canonical pathways of comparison analysis of genes overlap with most significant DMRs in children with top-tertile ALT, PDFF and NAFLD.
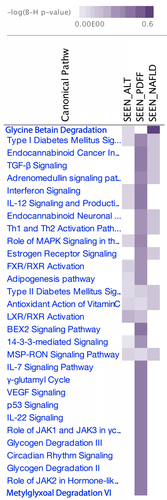
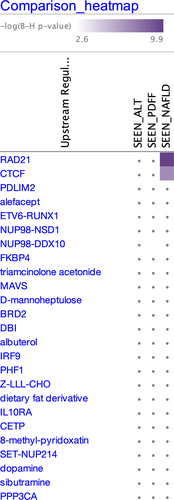
Figure 2. IPA Results for upstream regulators.
Supplemental material