
Figures & data
Figure 1. Macroscopic and histopathological analyses of rat livers upon methyl donor deficient diet. (a) Average body weights of healthy rats on choline-sufficient diet (CSAA) and rats on carcinogenic choline-deficient diet (CDAA) over 52-week experimental timeline. Bar graph represents average final body weights of CSAA and CDAA groups at the 52-week time-point. (b) Average liver weights and relative liver weights of CSAA and CDAA groups at the 52-week time-point. (c) Representative histopathological images at 4x and 20x magnification of whole livers from CSAA and CDAA groups. (d) Number of liver nodules in CSAA and CDAA livers with representative images of livers from rats in CSAA and CDAA groups. Results represent mean ± SD, n = 6 rats per group, **P < 0.01.
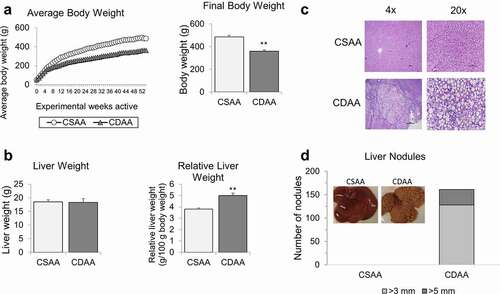
Figure 2. The landscape of genes differentially expressed in livers of healthy rats and HCC rats, as measured by RNA sequencing. (a) A chromosomal map of differentially expressed genes in livers of rats exposed to a choline-deficient diet (CDAA) as compared to healthy rats on a choline-sufficient diet (CSAA). (b) Functional analysis of genes differentially expressed in livers of CDAA vs. CSAA rats, using Gene ontology (in green) and KEGG pathway (in Orange) analyses. (c) Detailed analysis of metabolism-related pathways and corresponding genes that are downregulated (blue) or upregulated (red) within a given pathway in CDAA rats vs. CSAA rats based on RNA-seq. Categories with downregulated or upregulated genes are marked in blue and red, respectively. Grey boxes indicate categories with genes both upregulated and downregulated.
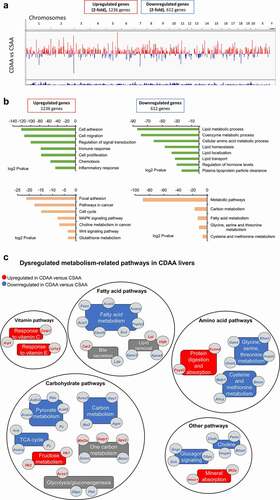
Figure 3. Lipid distribution and one-carbon metabolism pathways are altered upon carcinogenic choline-deficient diet. (a) Schematic of a lipid distribution pathway in the liver that is linked to choline metabolism. Red arrows indicate the direction of changes in gene expression as determined by RNA-seq and qRT-PCR. (b) Heat map based on fold-change values in RNA-seq for differentially expressed genes that are associated with a lipid distribution-related pathway (n = 4/group). (C, D, E) Boxplots depicting expression of Bhmt (c), apolipoproteins Apoa4, Apoa5, Apoc2, and Apoc3 (d), and Vldr and Lpl (e), on mRNA levels as validated by qRT-PCR in CSAA and CDAA livers. Results expressed as min, IQR, and max; n = 6 rats per group. ***P < 0.001. (f) Heat map based on fold-change values in RNA-sequencing for differentially expressed genes that are associated with a one-carbon metabolism pathway (n = 4/group). Schematic of one-carbon metabolism is shown in the right panel and red arrows indicate the direction of changes in expression of genes involved in the pathway. (g) Boxplots depicting expression of Mat2a and Gnmt on mRNA levels as validated by qRT-PCR in CSAA and CDAA livers. Results expressed as min, IQR, and max; n = 6 rats per group. ***P < 0.001. (h) SAM and SAH levels measured by liquid-chromatography mass-spectrometry (LC-MS)-based method in CSAA and CDAA livers. Results expressed as scatter plots; n = 6 rats per group. **P < 0.01 (CDAA vs. CSAA). (i) Boxplots depicting expression of Gstp1 and Gpx2 on mRNA levels as validated by qRT-PCR in CSAA and CDAA livers. Results expressed as min, IQR, and max; n = 6 rats per group. ***P < 0.001.
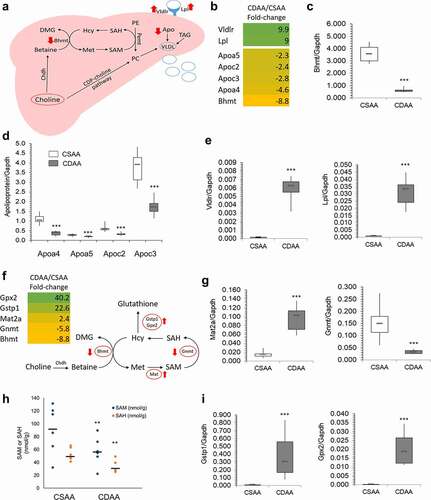
Figure 4. Upregulated oncogenes and oncogenic pathways in CDAA livers. (a) Heat map based on fold-change values in RNA-seq for differentially expressed genes with oncogenic functions (n = 4/group). (b) The differentially expressed oncogenes categorized into oncogenic signalling pathways based on GO function and KEGG pathway analyses generated by DAVID Knowledgebase.(c) Tracks depicting RNA-seq data for several top upregulated oncogenes, Mmp12, Jag1, and Pdgfd, generated using WashU Epigenome Browser. Red peaks indicate CSAA reads and blue peaks indicate CDAA reads from 4 rats per group which were analysed by RNA-seq. (d-f) Boxplots depicting publicly available data on expression of MMP12, JAG1 and PDGF in clinical samples in different types of cancer. The normal versus tumour gene expression data were obtained from Oncomine and GENT2 and are presented as log2-transformed median centred per array, and SD-normalized to 1 per array. All the presented changes are presented with a corresponding statistical significance level (P value).
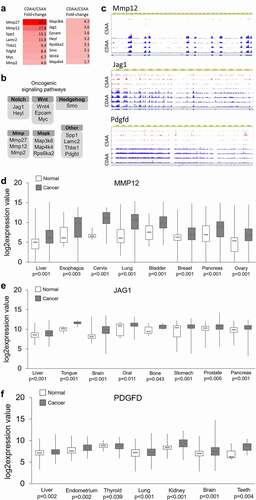
Figure 5. Dysregulation of DNA methylating and demethylating enzymes, and DNA hypomethylation of promoter regions of candidate oncogenes that are overexpressed in liver of rats exposed to carcinogenic choline-deficient diet. (a) Boxplots depicting expression of methylating enzymes Dnmts and demethylating enzymes Tets on mRNA levels as validated by qRT-PCR in CSAA and CDAA livers. Results expressed as min, IQR, and max. (b) Global levels of DNA methylation and DNA hydroxymethylation in CSAA vs. CDAA livers, as measured by liquid-chromatography mass-spectrometry (LC-MS)-based method in CSAA and CDAA livers. (c-f) The left panels show gene expression of Mmp12 (c), Jag1 (d), Wnt4 (e), and Smo (f), as measured by qRT-PCR in CSAA vs. CDAA livers. DNA methylation levels, as measured by pyrosequencing, are depicted in the right panels, along with maps of the tested regions. Numbers represent locations of first and last CpG sites relative to the transcription start site (TSS) (+1) within the tested region. Results are expressed as mean ± SD; n = 6 rats per group. # P < 0.1, *P < 0.05, **P < 0.01, ***P < 0.001.
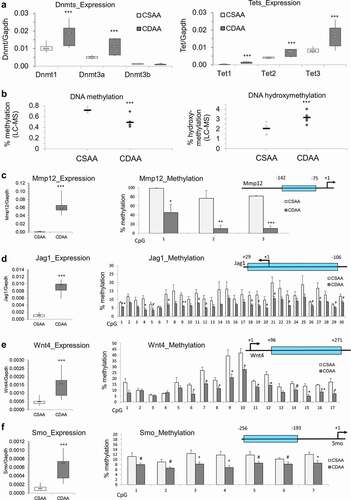
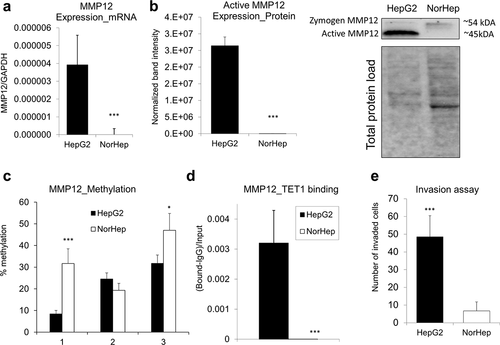
Figure 6. Overexpression and DNA hypomethylation of MMP12 in human HepG2 HCC cells is accompanied by TET1 increased occupancy at MMP12 promoter region. (a-b) Expression of MMP12 in human HepG2 HCC cells and in human primary hepatocytes (NorHep), as measured by qRT-PCR (a) and western blot (b). In western blot analyses, reactive bands were visualized using the chemiluminescent protocol in the ChemiDoc MP Imaging System (Bio-Rad) and analysed using the Image Lab software. Protein loading was normalized with respect to total sample protein loaded using free stain gels. (c) DNA methylation levels across three CpG sites within MMP12 promoter region in HepG2 and NorHep, as measured by pyrosequencing. (d) TET1 binding within MMP12 promoter region in HepG2 and NorHep, as measured by quantitative chromatin immunoprecipitation (qChIP). (e) Number of HepG2 and NorHep cells that invaded through extracellular matrix within 24 hr, as assessed by Boyden chamber invasion assay. Results are expressed as mean ± SD; n = 3, ***P < 0.001.
Supplemental Material
Download Zip (807.6 KB)Data Availability Statement
RNA sequencing data available in Gene Expression Omnibus (GEO, accession number: GSE199443).