Figures & data
Figure 1. Murine placenta and experimental design (a) Mouse placental structure. (b) Mouse exposure and mating timeline. (c) Generation of hybrid F1 mice. Parental alleles in the F1 hybrid mice can be distinguished by SNPs.
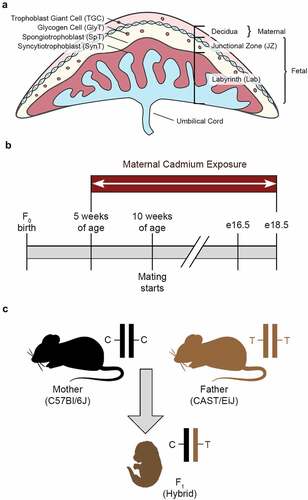
Figure 3. Effects of CdCl2 exposure on organ weights. All weights are normalized to embryonic weight and presented relative to controls. (a, b) Weights of e16.5 (a) and e18.5 (b) female organs. (c, d) Weights of e16.5 (c) and e18.5 (d) male organs. Data are presented as means ± SE. One-way ANOVA with Dunnett’s post-hoc test comparing 50 ppm and 1 ppm to 0 ppm. <p < 0.05, **p < 0.01, ***p < 0.001, ****p < 0.0001.
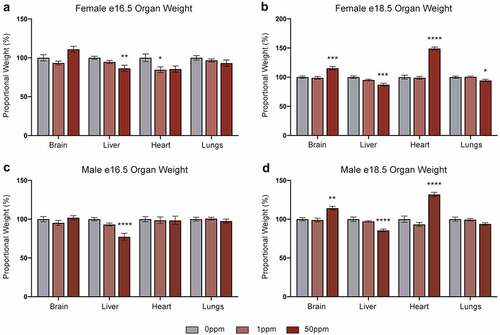
Figure 2. Effects of CdCl2 exposure on embryo and placenta weights (a, b) Weights of e16.5 and e18.5 female embryos (a) and placentae (b). (c, d) Weights of e16.5 and e18.5 male embryos (c) and placentae (d). Data are presented as means ± SE. One-way ANOVA with Dunnett’s post-hoc test comparing 50 ppm and 1 ppm to 0 ppm. *p<0.05, **p <0.01,***p<0.001, ****p<0.0001.
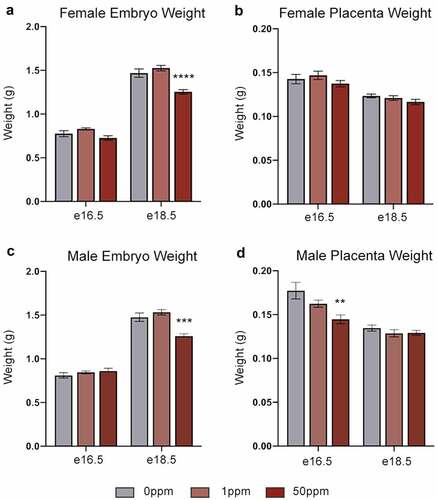
Figure 4. The Kcnq1 locus and Cdkn1c expression. (a) Organization of the Kcnq1 locus showing paternally (p) expressed Kcnq1ot1, and the maternally (m) expressed Cdkn1c and Kcnq1 genes. Shaded circles represent methylated CpGs, unshaded circles represent unmethylated CpGs, CpG clusters represent ICRs. (b, c) Cdkn1c transcript abundance in e16.5 (b) and e18.5 (c) female placental samples. (d) Ratio of Cdkn1c transcripts in female placental samples derived from the maternally- and paternally inherited alleles. (e, f) Cdkn1c transcript abundance in e16.5 (e) and e18.5 (f) male placental samples. (g) Ratio of Cdkn1c transcripts in male placental samples derived from the maternally- and paternally inherited alleles. Data are presented as means ± SE. Student’s t-test, two-tailed, comparing 0 ppm and 50 ppm. *p < 0.05, **p < 0.01.
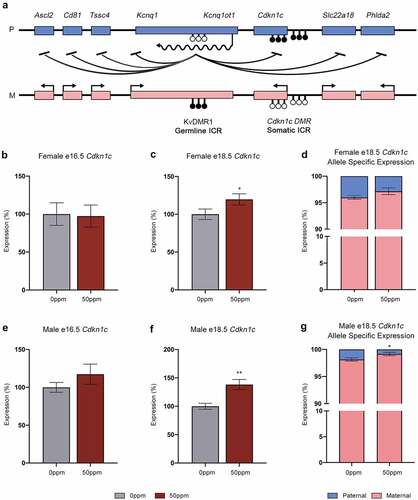
Figure 5. Gene expression at the Kcnq1 locus in placentae (a, b) Ascl2, Kcnq1, Kcnq1ot1, Slc22a18, and Phlda2 transcript abundance in e16.5 (a) and e18.5 (b) female placental samples. (c, d) Ascl2, Kcnq1, Kcnq1ot1, Slc22a18, and Phlda2 transcript abundance in e16.5 (c) and e18.5 (d) male placental samples. Data are presented as means ± SE. Student’s t-test, two-tailed, comparing 0 ppm and 50 ppm. *p < 0.05. ND = not detected.
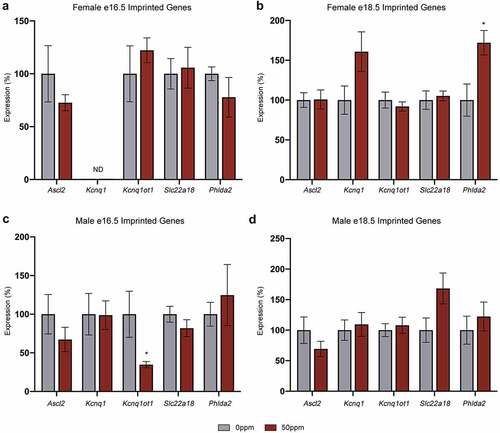
Figure 6. Methylation of Cdkn1c somatic ICR and KvDMR1 in female e18.5 placentae. (a, b) Percent methylation of two subsets of CpGs within the promoter of the Cdkn1c ICR in female e18.5 placental samples, quantified by pyrosequencing. (c, d) Percent methylation of 2 subsets of CpGs within the intragenic portion of the Cdkn1c ICR in female e18.5 placental samples, quantified by pyrosequencing. (e) Percent methylation for a subset of CpGs at KvDMR1 in female e18.5 placental samples, quantified by pyrosequencing. (f) Percent methylation on the paternal allele for a subset of CpGs at the Cdkn1c promoter in female e18.5 placental samples, quantified through amplification, cloning and sequencing of bisulphite-modified DNA. (g) Visual depiction of the methylation profiles of representative samples from each of the treatment groups. Each row represents a single unique amplicon. Open circles represent unmethylated CpGs, shaded circles represent methylated CpGs, missing circles represent incomplete sequence data. Data are presented as means ± SE. Student’s t-test, two-tailed, comparing 0 ppm and 50 ppm. **p < 0.01.
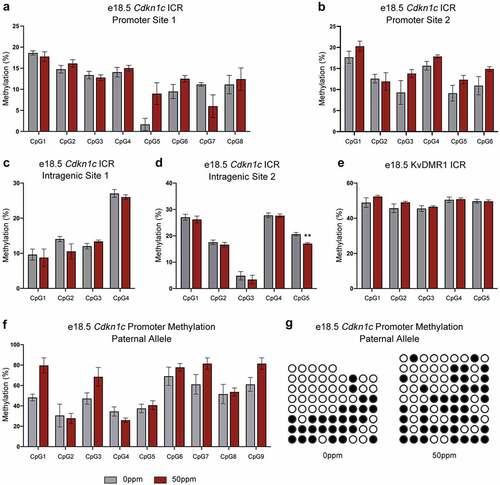
Figure 7. RRBS analysis of Cdkn1c somatic ICR methylation in female placentae. (a) Total percent methylation across the Cdkn1c somatic ICR promoter and intragenic regions as measured by RRBS. (b) Visualization of methylated CpGs across the Cdkn1c promoter and gene for four 0 ppm and four 50 ppm exposed placental samples. Peak height represents percent methylation.
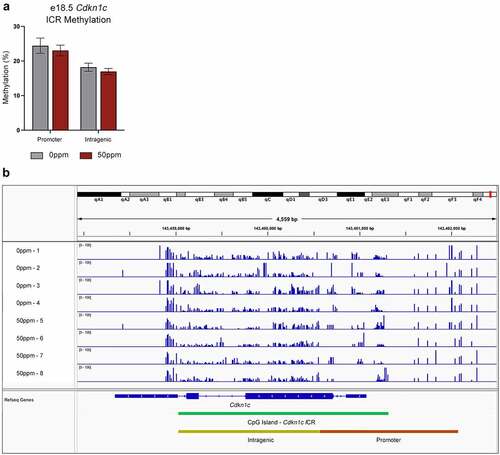
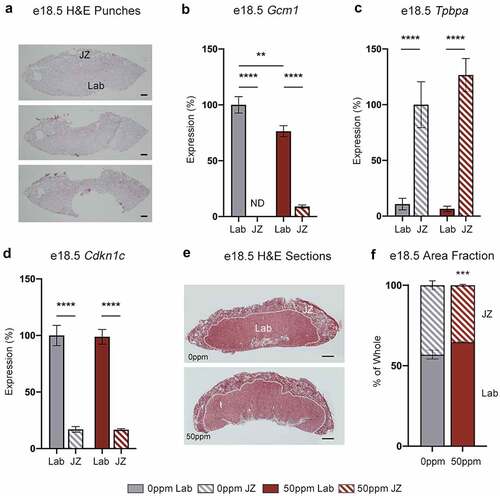
Figure 8. Placental layer-specific gene expression and area fraction analysis. (a) H&E stained sections of a representative fresh frozen e18.5 female placenta prior to micropunches (top), after JZ micropunch (middle) and after Lab micropunch (bottom), showing the relative locations and sizes of the tissue micropunches. Scale bar = 500 μm. (b, c) Gcm1 (b) and Tpbpa (c) transcript abundance in e18.5 female placental Lab and JZ, demonstrating the specificity of the micropunches to each layer. Data are normalized to transcript abundance in the 0 ppm Lab (Gcm1) or 0 ppm JZ (Tpbpa). ND = not detected. (d) Cdkn1c transcript abundance in e18.5 female placental Lab and JZ. Data are normalized to transcript abundance in the 0 ppm Lab. (e) Representative e18.5 female placental samples paraffin-embedded and stained with H&E for area fraction analysis. Scale bar = 1 mm. (f) Area fractions of Lab and JZ calculated from total area visualized through H&E staining. Data are presented as means ± SE. B, C, E analysed by one-way ANOVA with Tukey’s post-hoc test comparing 0 ppm to 50 ppm exposures within Lab and JZ, and Lab to JZ within each 0 ppm and 50 ppm exposures. **p < 0.01, ***p < 0.001, ****p < 0.0001. F analysed by Student’s t-test, two-tailed, comparing 0 ppm and 50 ppm. ***p < 0.001. ND = not detected.