
Figures & data
Table 1. qPCR primer sequences of human genes indicated in 5`-3` direction. bp, base pairs; fw, forward; Length, amplicon length; rev, reverse.
Table 2. qPCR primer sequences of human IL10 in promoter regions (#1, #2, #3) and a non-promoter region (#4) indicated in 5`-3` direction. bp, base pairs; fw, forward; Length, amplicon length; rev, reverse.
Figure 1. Compressive force increases global histone lysine acetylation further augmented by oleic acid exposure. (a, b) Quantitative expression analysis of genes encoding histone acetyl transferases TAF1, EP300 and CREBBP (a) and encoding histone deacetylases HDAC1, HDAC2 and HDAC3 (b) in human periodontal ligament fibroblasts (HPdLFs) exposed to oleic acid (OA) and stimulated with compressive force (CF) compared to BSA controls. (c, d) Analysis of global H3 lysine acetylation level (H3Kac) presented in representative microphotographs of HPdLFs treated with OA and stimulated with CF in comparison to BSA controls (c) and analysed in (d) in relation to BSA control as percent changes. DAPI labels the cell nuclei and H3Kac staining is shown in thermal LUT (H3Kac th. LUT), indicating staining intensity. The dashed lines illustrate the positions of the cell nuclei. *** p < 0.001 in relation to BSA, ### p < 0.001 in relation to PA, §§§ p < 0.001 in relation to BSA + CF; One-Way ANOVA and post hoc test (Tukey). Scale bars: 10 μm in (c). n.s., not significant; RNE, relative normalized expression.
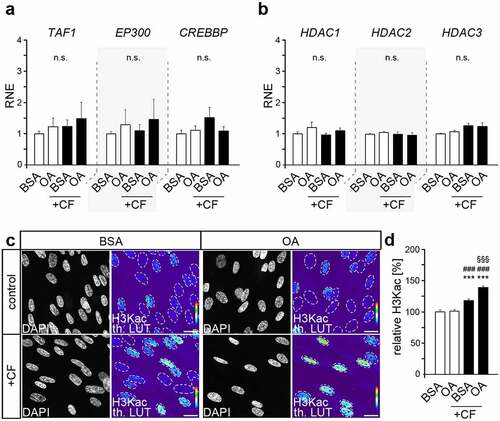
Figure 2. Histone lysine deacetylation revealed increased IL10 expression comparable to that of compressed HPdLFs exposed to oleic acid. (a) Analysis of the metabolic activity of human periodontal ligament fibroblasts (HPdLFs) treated one day with different concentrations of FK228, a histone deacetylase (HDAC) inhibitor. DMSO was used as control. (b) Analysis of metabolic activity of HPdLFs treated for 1d, 2d or 4d with 10 nM FK228 compared to DMSO control. (c, d) Analysis of the activity of HDACs (c) and histone acetyltransferases (HATs; d) in HPdLFs treated one day with 10 nM FK228 in comparison to DMSO control. (e, f) Analysis of global H3K acetylation level (H3Kac) visualized in representative microphotographs of HPdLFs treated one day with 10 nM FK228 compared to DMSO control (e) and analysed in (f) in relation to DMSO control as percent change. DAPI labels the cell nuclei and H3Kac staining is shown in thermal LUT (H3Kac th. LUT), indicating intensity. The dashed lines illustrate the positions of the cell nuclei. (g, h) Quantitative expression analysis of IL10 in HPdLFs treated one day with 10 nM FK228 (g) as well as in HPdLFs exposed to oleic acid (OA) and stimulated with compressive force (CF) in comparison to BSA control. Expression data in (f) were normalized to the non-forced BSA control (not shown). *** p < 0.001 in relation to DMSO in (b), (c), (f) and (g), and in relation to BSA in (h); One-Way ANOVA and post hoc test (Tukey). Scale bars: 10 μm in (e). n.s., not significant.
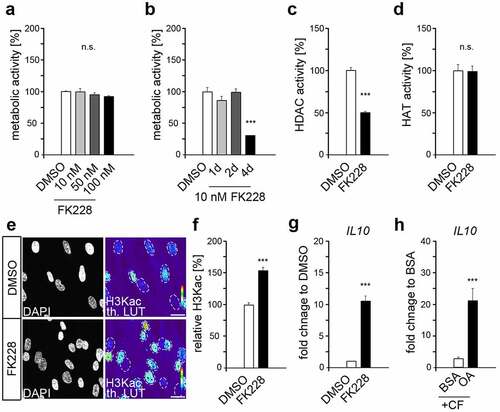
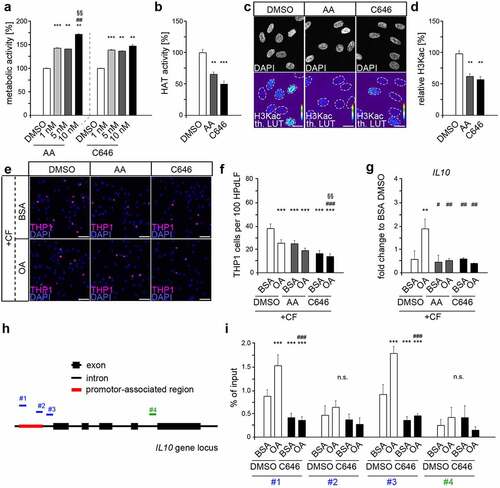
Figure 3. Oleic acid exerts its anti-inflammatory effect in force-stressed HPdLFs via increased histone acetylation potentially on the IL10 gene promoter (a) Analysis of the metabolic activity of human periodontal ligament fibroblasts (HPdLFs) treated one day with different concentrations of anacardic acid (AA) or C646, both are histone acetyltransferase (HAT) inhibitors. DMSO was used as control. (b) Analysis of HAT activity in HPdLFs treated one day with 10 nM AA or 1 nM C646 in relation to DMSO control. (c, d) Analysis of global H3K acetylation level (H3Kac) visualized in representative microphotographs of HPdLFs treated one day with 10 nM AA or 1 nM C646 compared to DMSO control (c) and analysed in (d) in relation to DMSO control as percent change. DAPI labels the cell nuclei and H3Kac staining is shown in thermal LUT (H3Kac th. LUT), indicating intensity. The dashed lines illustrate the positions of the cell nuclei. (e, f) Analysis showing representative microscopic images of fluorescently labelled, adherent THP1 monocytic cells (violet) on compressed HPdLFs exposed to oleic acid (OA) after one-day treatment with 10 nM AA or 1 nM C646 in relation to BSA and DMSO controls (e) analysed as relative number of THP1 cells per 102 HPdLFs in (f). Cell nuclei were labelled with DAPI. (g) Quantitative expression analysis of IL10 in compressed HPdLFs exposed to OA after one-day treatment with 10 nM AA or 1 nM C646 in comparison to BSA and DMSO controls. Expression data were normalized to the non-forced BSA DMSO control (not shown). (h) Locations of DNA primer amplified regions in the human IL10 gene locus indicating promoter-associated pairs (blue, #1, #2 and #3) and a non-promoter-associated pair (green, #4). (i) Quantitative analysis of the association of specific IL10 gene regions shown in (e) with acetylated H3K in compressed HPdLFs exposed to OA and treated for one day with 1 nM C646 in comparison to the respective controls. Data were normalized to the sample input controls. ** p < 0.01, *** p < 0.001 in relation to DMSO in (a), (b) and (c) and in relation to BSA DMSO + CF in (f), (g) and (i); ## p < 0.01 in relation to 1 nM AA in (a); # p < 0.05, ### p < 0.001 in relation to OA DMSO + CF in (f), (g) and (i). §§ p < 0.01 in relation to 5 nM AA in (A) and in relation to BSA C646 + CF in (f); One-Way ANOVA and post hoc test (Tukey). Scale bars: 10 μm in (c) and (e). n.s., not significant.
Data availability statement
The datasets of this study are available from the corresponding author, JS, on reasonable request. The data are not publicly available due to very large size of microscopy images https://figshare.com/projects/Oleic_acid-related_anti-inflammatory_effects_in_force-stressed_PdL_fibroblasts_are_mediated_by_H3_lysine_acetylation_associated_with_altered_IL10_expression/130172