Figures & data
Table 1. Characteristics of participants in the CHAMACOS birth cohort with Illumina 450K DNA methylation profiles from umbilical cord blood samples (N = 372).
Figure 1. Performance of the DNAm GA Clock Predictions in the CHAMACOS Cohort Using Illumina 450K (N = 372) and EPIC (N = 108) DNAm Arrays. Pearson’s correlation and median absolute error (MAE) between chronological gestational age and DNAm GA calculated using (a) Knight’s clock and the 450K methylation data, (b) Knight’s clock and the EPIC methylation data, (c) Bohlin’s clock and the 450K methylation data, and (d) Bohlin’s clock and the EPIC methylation data.
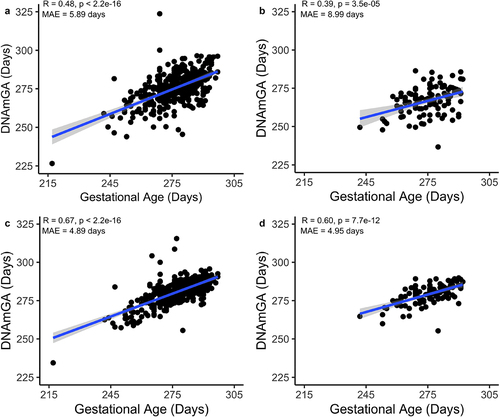
Figure 2. Comparison of DNAm GA Predictions by the Knight vs. Bohlin Clock Across the Same DNAm Array. Pearson’s correlation between (a) Knight DNAm GA and Bohlin DNAm GA determined from the 450K DNA methylation data (N = 372) and (b) Knight DNAm GA and Bohlin DNAm GA determined from the EPIC DNA methylation data (N = 108).
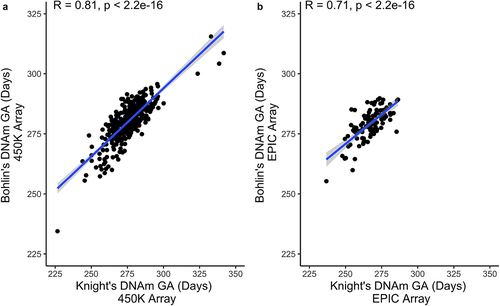
Figure 3. Comparison of DNAm GA Predictions by the Illumina 450K vs. EPIC DNAm array across the same epigenetic clock (N=108). Pearson’s correlation between (a) Knight’s DNAm GA from the EPIC array and Knight’s DNAm GA from the 450K array (b) Bohlin’s DNAm GA from the EPIC array and Bohlin’s DNAm GA from the 450K array.
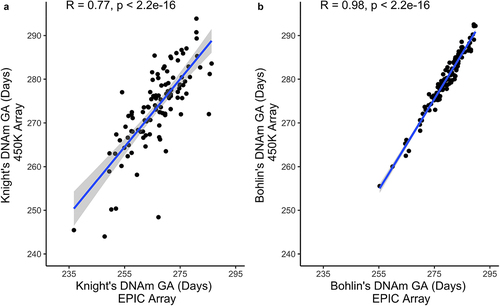
Table 2. Adjusted associations between gestational age acceleration estimated by the Knight and Bohlin epigenetic clocks with prenatal and birth characteristics in the CHAMACOS cohort (N = 372)†,‡.
Figure 4. Adjusted Associations between Gestational Age Acceleration and Prenatal and Birth Characteristics in the CHAMACOS Cohort (N = 372)†. Estimates (β) and 95% CIs for characteristics significantly associated with gestational age acceleration after adjusting for maternal age at delivery, maternal smoking during pregnancy, maternal education, marital status, and infant sex across the two clocks. †Units for maternal serum triglyceride and maternal serum lipid levels converted from standard mg/dL to d/L for greater comparability of effect sizes in plot.
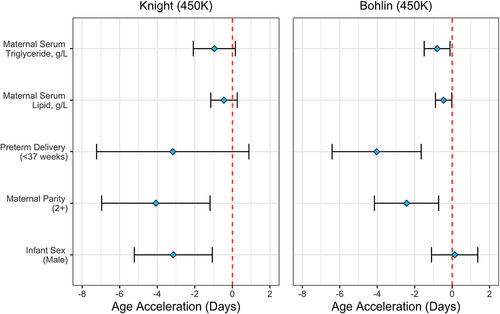
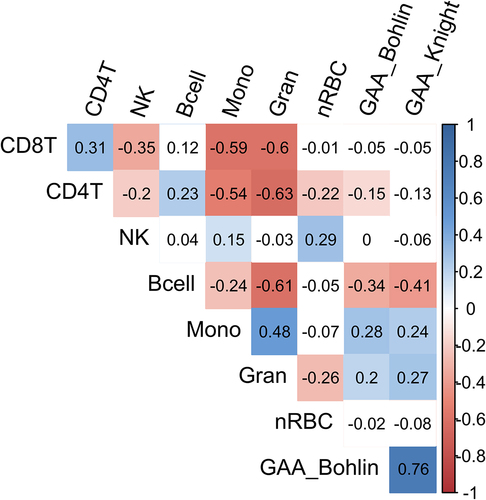
Figure 5. Correlations Coefficients Between Estimated Cell-Type Proportions and Gestational Age Acceleration Estimated by the Knight and Bohlin Clocks (N = 372). Pearson’s correlations between cell-type proportions estimated from DNA methylation profiles and gestational age acceleration calculated by the Bohlin and Knight models using the 450K array (blank/white cell = non-significant correlation p > 0.05).