Figures & data
Figure 1. Validation of the hypermethylated regions identified with MIRA-seq in cBCL was done with the EpiTYPER. Methylation fraction as determined by the EpiTYPER in the evaluable CpGs in the differentially methylated regions are shown for HOXA13. The black dots and triangles represent EpiTYPER data for cBCL and normal lymph node aspirate samples respectively. The bar plots represent the interquartile range and the horizontal line in the bar plots represent the median. The normal population included 10 dogs that did not develop lymphoma within a 1-year period.
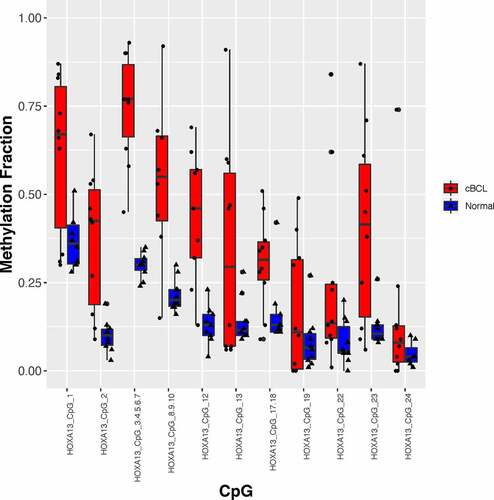
Figure 2. Batch corrected log2 transformed hypermethylated and hypomethylated rpkm data. The cBCL samples separated into 2 branches. These branches likely reflect a technical batch effect and not a biological difference. Samples MIRA_BCL9, MIRA_BCL16, MIRA_BCL18 and MIRA_BCL19 were sequenced with the first branch but clustered in the second branch and with all of the libraries that were produced and sequenced at an earlier date (Group A). DMRs were identified from the MIRA-seq of 23 cBCL and 7 normal B cell samples. The heatmap shows unsupervised hierarchical clustering of the 13,982 hypermethylated and 4467 hypomethylated DMRs in cBCL with a fold change value equal to or greater than 2. DMRs were identified with a q < 0.001 (Benjamin-Hochberg correction). Log2 of 1+ RPKM transformation of the values of each DMR was used for visualization purposes.
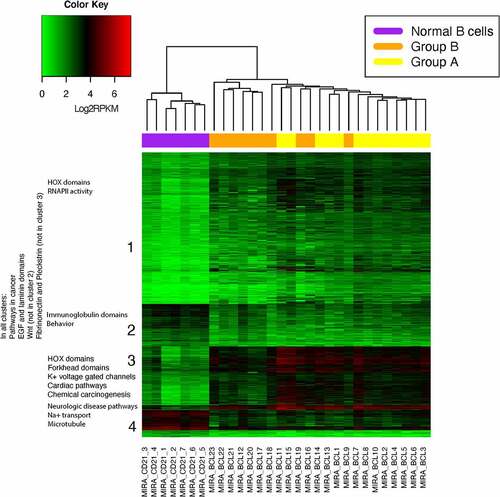
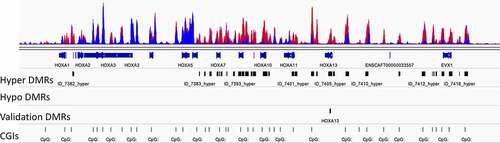
Figure 3. Focal areas of hypermethylation were distributed throughout the HOX clusters. The HOXA cluster on chromosome 14 is shown. The top track has the methylation profiles of 23 cBCL (red) and 7 normal B cell (blue) samples overlain. There were clusters of hypermethylated differentially methylated regions (DMRs) in the HOXA cluster. There were no hypomethylated DMRs in this region. A hypermethylated region in HOXA13 was selected for validation. CpG islands are shown in the bottom track.