
Figures & data
Figure 1. Expression pattern of lncRNA Gm10561. (a) qPCR showing that expression of Gm10561 was induced during myogenic differentiation. The myogenic marker MyHC was used as a positive control. (b) Relative expression of Gm10561 in 11 mice tissues (brain, heart, lung, liver, spleen, kidney, stomach, large intestine, small intestine, fat, leg muscle) as determined by qPCR. Gm10561 expression was highest in leg muscle. (c) Distribution of Gm10561 in the cytoplasm and nuclei of proliferating C2C12 cells (D0) and C2C12 cells differentiated for 3 days (D3). Relative RNA expression was normalized to the control gene β-actin. Data represent mean ± standard deviation (SD) of three independent biological replicates.
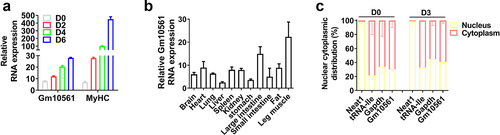
Figure 2. Knockdown of Gm10561 inhibited proliferation and differentiation of C2C12 myoblasts. (a) qPCR showing mRNA expression of Ki67 was significantly reduced by Gm10561 knockdown. (b) Western blotting showing Gm10561 knockdown remarkably reduced Ki67 protein levels. Expression was quantified using ImageJ software. (c) CCK-8 assay detected C2C12 cell proliferation following Gm10561 knockdown at 12, 24, 36, and 48 h. Gm10561 knockdown dramatically suppressed cell proliferation. (d) EdU staining showed that the proportion of EdU+ cells was decreased following Gm10561 knockdown. (e) qPCR showing that mRNA expression of MyoD, MyoG, and MyHC was significantly reduced by Gm10561 knockdown. (f) Western blotting showing that Gm10561 knockdown remarkably reduced MyoD, MyoG, and MyHC protein expression. Protein expression was quantified using ImageJ. (g and h) Immunofluorescence staining of MyoG and MyHC showed that the percentage of MyoG+ (g) and MyHC+ (h) cells was significantly inhibited by Gm10561 knockdown. Relative RNA and protein levels were standardized to β-actin and tubulin, respectively. Data represent mean ± SD of three independent biological replicates. *P < 0.05; **P < 0.01.
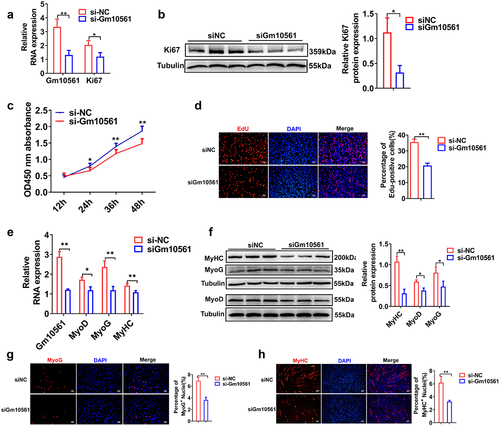
Figure 3. Gm10561 knockdown inhibited skeletal muscle growth in vivo. (a) qPCR showing that the expression of Gm10561 was significantly knocked down by LV-sh-Gm10561 particle injection. (b) Western blotting showing that protein expression of MyoG and MyHC was decreased following LV-sh-Gm10561 particle injection. Protein expression was quantified using ImageJ. (c) Representative images of the Qu, TA, and Gas muscles of the LV3-sh-Gm10561 and LV3-sh-NC groups (N = 10). (d) Weights of the Qu, TA, and Gas muscles of the LV3-sh-Gm10561 and LV3-sh-NC groups. The weights of three muscles were decreased by LV3-sh-Gm10561 injection (N = 10). (e) Representative images of haematoxylin and eosin staining of the Qu, TA, and Gas muscles of the LV3-sh-Gm10561 and LV3-sh-NC groups (N = 3). (f) Fibre sizes of the Qu, TA, and Gas muscles in (e). Fibre size were smaller in the LV3-sh-Gm10561 group compared to the LV3-sh-NC group. Relative RNA and protein levels were standardized to β-actin and tubulin, respectively. Data represent mean ± SD of three independent biological replicates. *P < 0.05; **P < 0.01.
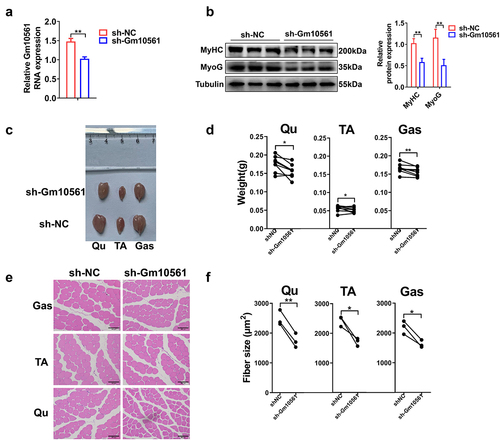
Figure 4. Overexpression of Gm10561 promoted proliferation and differentiation of PSCs. (a) qPCR showing that all three transcripts of Gm10561 were successfully overexpressed in PSCs. (b) Western blotting showing that expression of Ki67 was significantly increased following Gm10561v1, Gm10561v2, and Gm10561v3 overexpression. Expression was quantified using ImageJ. (c) EdU staining of PSCs. The proportion of EdU+ cells was significantly increased following Gm10561v1, Gm10561v2, and Gm10561v3 overexpression. (d) Western blotting of MyoD and MyoG expression in PSCs. Protein expression of MyoD and MyoG was significantly increased after Gm10561v1 overexpression, but not after Gm10561v2 and Gm10561v3 overexpression. Expression was quantified using ImageJ. (e) Representative images of MyHC immunofluorescence staining of PSCs. Gm10561v1 overexpression, but not that of Gm10561v2 and Gm10561v3, significantly increased the proportion of MyHC+ cells. Relative RNA and protein levels were standardized to β-actin and tubulin, respectively. Data represent mean ± SD of three independent biological replicates. N.S., not significant; *P < 0.05; **P < 0.01.
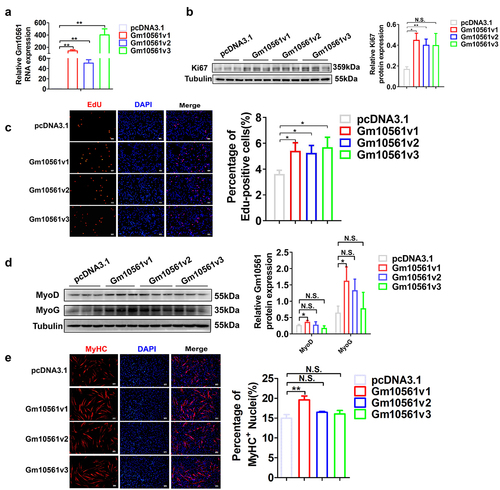
Figure 5. Gm10561 competes with miR-432 to bind MEF2C and E2F3. (a) Heat map of the most differentially expressed mRNAs between the Gm10561 knockdown groups and the NC control group (fold change ≥ 2; P < 0.05). (b) GO term analysis of DEGs of Gm10561. (c) KEGG enrichment analysis of DEGs of Gm10561. (d) qPCR of the RNA immunoprecipitation assay showed that Gm10561 can interact with Ago2 in C2C12 myoblasts. (e) Luciferase reporter assay of Luc‐Gm10561 in C2C12 myoblasts showed that miR‐432 overexpression reduced luciferase activities. (f) Luciferase reporter assay of Luc‐Gm10561 and Luc‐Gm10561-Mut in C2C12 myoblasts showed that Gm10561 specifically bound miR-432. (g) Venn analysis to obtain the intersection of genes downregulated by Gm10561 knockdown and miR-432 target genes predicted by RNAhybrid and TargetScan. (h) Luciferase reporter assay of Luc‐MEF2C 3’ UTR and Luc‐MEF2C 3’ UTR-Mut in C2C12 myoblasts showed that miR-432 specifically bound the MEF2C 3’ UTR. (i) Luciferase reporter assays of Luc‐MEF2C‐3’ UTR in C2C12 myoblasts showed that Gm10561 competes with the MEF2C‐3′ UTR to bind miR‐432. (j) Luciferase reporter assays of Luc‐E2F3‐3’ UTR in C2C12 myoblasts showed that Gm10561 competes with the E2F3‐3′ UTR to bind miR‐432. Data represent mean ± SD of three independent biological replicates. N.S., not significant; *P < 0.05; **P < 0.01.
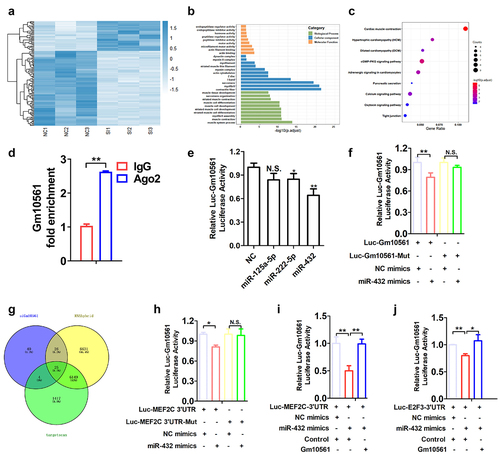
Figure 6. Gm10561 regulates MEF2C and E2F3 by targeting miR-432. (a and b) qPCR showing that mRNA expression of MEF2C and E2F3 was significantly reduced by Gm10561 knockdown in proliferating C2C12 myoblasts (a) and C2C12 myoblasts differentiated at 3 days (b). (c and d) Western blotting showing that Gm10561 knockdown decreased MEF2C and E2F3 protein expression in proliferating C2C12 myoblasts (c) and C2C12 myoblasts differentiated at 3 days (d). Expression was quantified using ImageJ. (e and f) Western blotting showing that expression of MEF2C and E2F3 was significantly increased by miR-432 inhibitor transfection in proliferating C2C12 myoblasts (e) and C2C12 myoblasts differentiated at 3 days (f). Expression was quantified using ImageJ. (g) Western blotting showing that Gm10561 knockdown inhibited MEF2C and E2F3 expression in C2C12 myoblasts, but not when co-transfected with miR-432 inhibitor. Relative RNA and protein levels were standardized to β-actin and GAPDH, respectively. Data represent mean ± SD of three independent biological replicates. *P < 0.05; **P < 0.01.
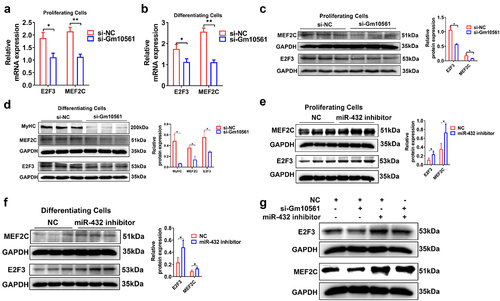
Figure 7. Gm10561 contributes to myogenesis by sponging miR-432. (a) EdU staining showed that the proportion of EdU+ cells was decreased following Gm10561 knockdown in C2C12 myoblasts. When co-transfected with miR-432 inhibitor, Gm10561 knockdown did not reduce the proportion of EdU+ cells. (b) CCK-8 assay detected C2C12 cell proliferation following Gm10561 knockdown for 48h. Gm10561 knockdown suppressed cell proliferation, but not when co-transfected with miR-432 inhibitor. (c) Western blotting showing that Gm10561 knockdown decreased MyoG and MyHC expression, but not when co-transfected with miR-432 inhibitor in C2C12 myotubes. (d) Immunofluorescence staining of MyHC showed that the proportion of MyHC+ cells was decreased following Gm10561 knockdown in C2C12 myotubes. When co-transfected with miR-432 inhibitor, Gm10561 knockdown did not decrease the proportion of MyHC+ cells. Protein expression was normalized to tubulin. Data represent mean ± SD of three independent biological replicates. N.S., not significant; *P < 0.05; **P < 0.01.
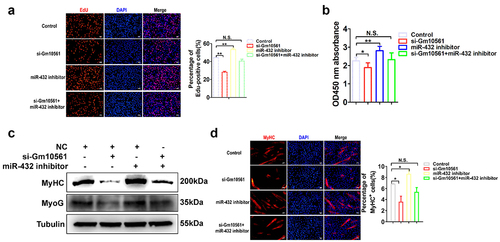
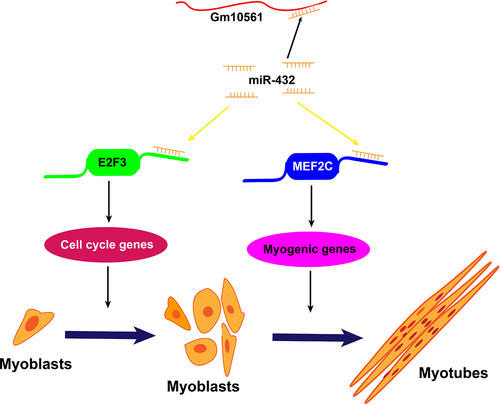
Figure 8. Model of Gm10561 sponging of miR-432 to accelerate myogenesis. In this model, miR-432 directly targets the 3’ UTR of E2F3 and MEF2C mRNAs to inhibit their expression. E2F3 is known to promote the proliferation of myoblasts, MEF2C is known to promote the differentiation of myoblasts. In proliferating myoblasts, Gm10561 sponges miR-432 to weaken the inhibition of miR-432 on E2F3, and promote E2F3 expression, resulting in enhanced myoblast proliferation. Upon differentiation, Gm10561 sponges miR-432 to attenuate the suppression of miR-432 on MEF2C, increase the expression of MEF2C, and thus promote myoblast differentiation.
Supplemental Material
Download Zip (3.9 MB)Data availability statement
The authors confirm that the data supporting the findings of this study are available within the article and/or its supplementary materials. The sequencing data for RNA-seq in this study have been uploaded to online repositories. The name of the repository and accession number can be found below: https://www.ncbi.nlm.nih.gov/bioproject/PRJNA851100/, PRJNA851100.