Figures & data
Figure 1. Toolkit of Epigenetic Editors. a Schematic of epigenetic modulator design based on SunTag framework. 5xGCN4 sequences bound to dCas9 recruit epigenetic effectors fused with anti-GCN4 scFv antibody fragments to the sites directed by sgRNA. b Epigenetic modulators used in this study and their effects on histone marks. c Epigenetic editors alter histone marks in a site-specific manner. Each graph is normalized to input and represents biological triplicates.
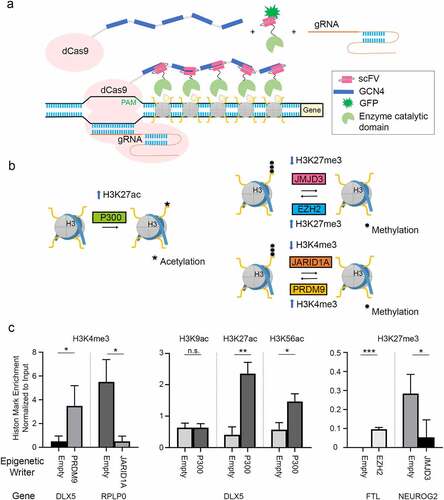
Figure 2. Screening of single gene promoter. a Scale diagram of promoter region of SNCA gene showing two alternative non-coding Exon 1 and Exon 2 with a start codon (ATG) as well as locations of sgRNA used. b Histone mark enrichment from our HEK293 dCas9 cell line for the indicated marks. (Peak locations are scaled to diagram shown in a. Average PCR bin size = 275 ± 25 base pairs). c qPCR assay was carried out to determine the change in α-synuclein expression levels relative to empty scFv control (Set to 1) for JARID1A and EZH2 targeted to specified loci by sgRNA. (Locations are scaled to diagram shown in a). Each point is normalized to empty control and represents biological triplicates. d,e Histone mark changes after transfection with indicated sgRNA and d JARID1A-scFv or e EZH2-scFv. Black lines indicate location of the sgRNA targeting site on the chromosome. Average PCR bin size = 275 ± 25 base pairs. f qPCR assay shows the change in α-synuclein expression levels relative to empty scFv control for JARID1A and EZH2 targeted separately or together to a single sgRNA target site shows that combined targeting is more effective than either alone. * = p < 0.05, ** = p < 0.01, *** = p < 0.001.