
Figures & data
Table 1. Clinical and demographic characteristics of NLST subjects by gender; count or mean (SD).
Figure 1. The relationship between cg05575921 methylation and smoking intensity (cigarettes per day) in currently smoking subjects with males at top (N = 840, trend p = 0.012, adj R-sq = 0.009, deviance explained = 1.162%) and females at bottom (N = 654, trend p = 0.084, adj R-sq = 0.007, deviance explained = 1.140%).
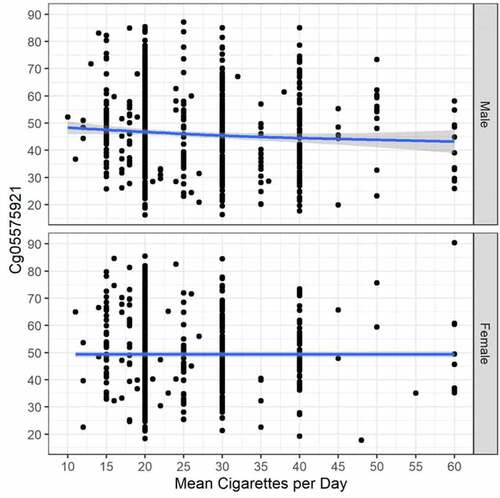
Figure 2. The relationship between cg05575921 methylation and pack year consumption in currently smoking subjects with males at top (N = 840, trend p < .001, adj R-sq = 0.039, deviance explained = 4.786%), and females at bottom (N = 654, trend p = 0.002, adj R-sq = 0.017, deviance explained = 2.017%).
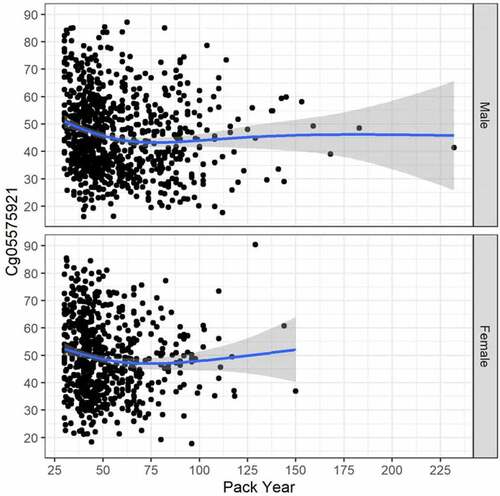
Figure 3. The relationship between cg05575921 methylation and years of smoking cessation in subjects who have reported quitting smoking (N = 1535, trend p < .001, adj R-sq = 0.164, deviance explained = 16.741%).
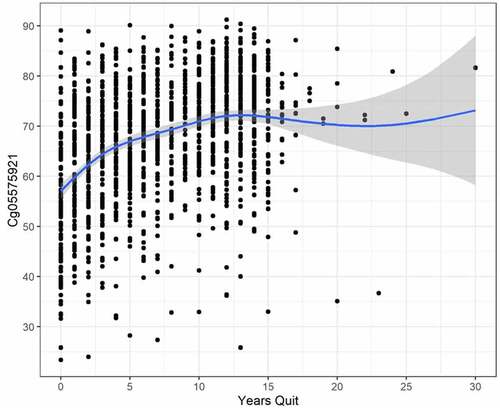
Table 2. Survival model selection results.
Table 3. Parameter estimates for best model.
Figure 4. The time-varying AUC (95% CIs) for the top five fitting models (in order of AIC fit, Model 5, 11, 1, 2, 6; see ). The times were the quantiles of the event times (in years) .
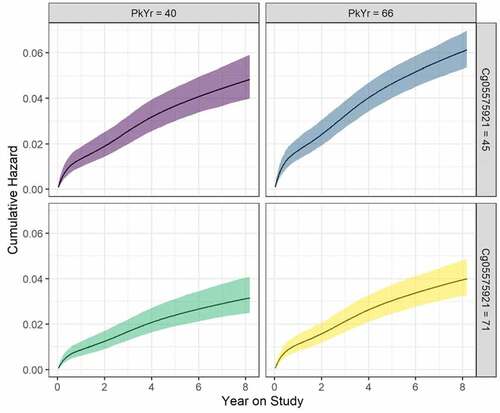
Figure 5. Cumulative hazard (95% confidence ribbons) as a function of year on study, pack years consumption (PY), and Cg05575921. Values for the latter two are set at the 25th and 75th percentiles, and age is set to the mean of the sample. Curves are estimated based on the best fitting survival model () .
Data availability statement
The genome-wide data included in this manuscript were prepared with funding from the United States National Institutes of Health (NIH). They are not yet publicly available.