
Figures & data
Table 1. Participants’ characteristics in the study (N = 48).
Figure 1. Comparison of distribution and methylation levels of all differentially methylated genes across the human genome between five GDM samples and five healthy controls. Up-regulated and down-regulated genes after screening are indicated in green and yellow, respectively. The outer ring with numbers 1 to 22 respectively represents 22 autosomes. The inner ring with red and blue pattern shows the methylation levels of DMGs. Circle graph of DMGs throughout autosomal chromosome showing -log10 (p-value).
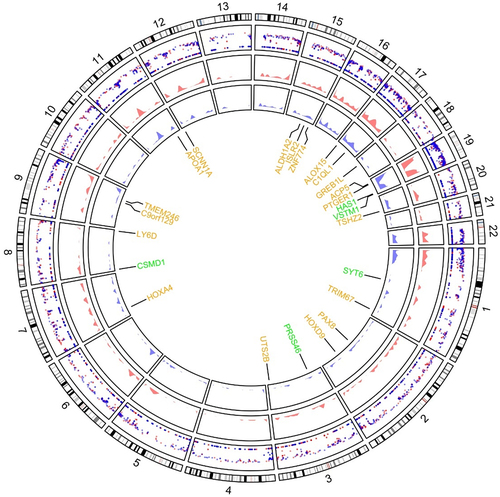
Figure 2. (a) Proportion of differentially methylated CpG sites identified by RRBS analysis from 5 GDM samples and 5 healthy controls in relation to genomic location across the human genome. UTR: untranslated region; CDS: coding domain sequence. (b) The volcano plot of all differentially expressed genes comparing 4 GDM samples with 4 control groups (p-value <0.05) including up-regulated genes (yellow dots) and down-regulated genes (green dots) by RNA-Seq analysis.
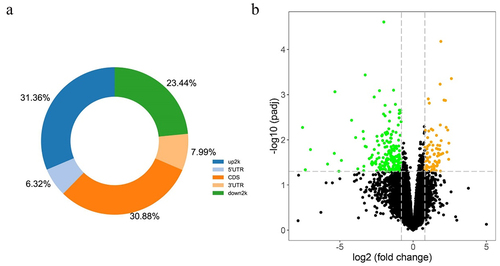
Figure 3. The Venn graph integrated RRBS and RNA-Seq results showing the whole number of aberrantly methylated-differentially expressed genes overlapped including five up-regulated genes (a) and nineteen down-regulated genes (b). (c) A total of 24 screened genes were shown in heatmap according to the expression levels between four GDM samples and four healthy controls, which were also signed in identifying their location in chromosomes.
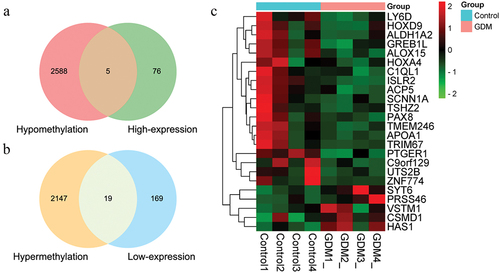
Figure 4. Graph of differentially methylated regions in TRIM67 gene assessed by pyrosequencing (a) and diagram plots of nucleotide sequence of three representative transcription factors binding sites (b, c, d). (a) CpG sites 3, 5, 7 and 9 exhibited significant hypermethylation levels (blue solid circular) in TRIM67 promoter between GDM samples and healthy controls. Most representative TF (b)GATA2, (c)TEAD4, and (d)NR2F2 in TRIM67 promoter were selected and identified by JASPAR database. The size of the capital letters at each position is proportional to the frequency of nucleotide bases.
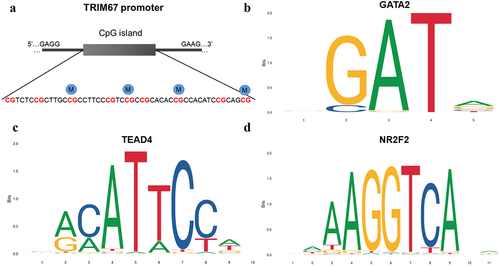
Figure 5. Comparison with the methylation level of TRIM67 CpG sites between 24 GDM samples and 24 healthy controls (NC) by pyrosequencing analysis. Pearson Chi-square test, *: p < 0.05; **: p < 0.01; ***: p < 0.001.
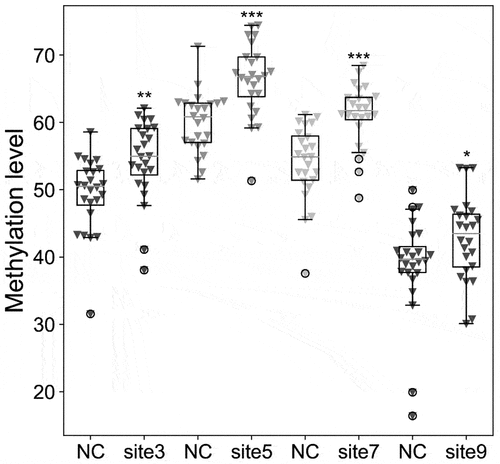
Table 2. Basic information for the top five candidate differentially expressed genes between 24 GDM samples and 24 healthy controls.
Table 3. Detail information for representative predicted transcription factors in the promoter region of TRIM67 predicted using JASPAR database.
Figure 6. The Gene Ontology (GO) enrichment bar graph of up-regulated genes (red bars) and down-regulated genes (green bars) among all methylated-differentially expressed genes.
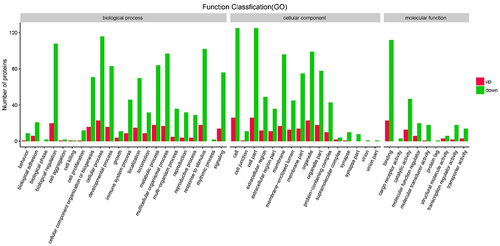
Figure 7. The Kyoto Encyclopaedia of Genes and Genomes (KEGG) pathways bubble chart of all methylated-differentially expressed genes. Data are presented as enriched scores expressed as -log10(p-value).
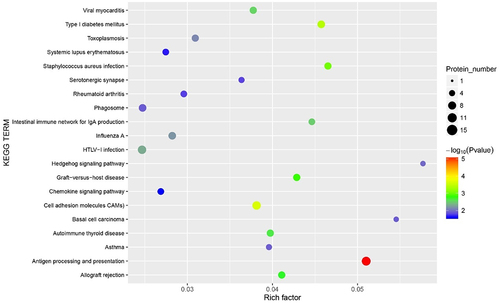
Table 4. Spearman’s correlation analysis showing the association between differentially methylated CpG sites of TRIM67 and fasting glucose, 1 h OGTT, 2 h OGTT, and Lp(a) between 24 GDM samples and 24 healthy controls.
Table 5. Linear regression analysis of differentially methylated TRIM67 CpG sites and glucose/lipid metabolism, adjusting for age and BMI between 24 GDM samples and 24 healthy controls.
Supplemental Material
Download MS Word (734.9 KB)Data availability statement
The authors confirm that the data supporting the findings of this study are available within the article and its supplementary materials.