
Figures & data
Figure 1. Genomic landscape of ZBTB38 binding sites determined by ChIP-sequencing in human cells. (a) Genomic tracks display ZBTB38 ChIP-sequencing data (replicates 1 and 2) and input data (replicates 1 and 2) on a representative 5-Mb region of chromosome 11. (b) Average tag intensity of ZBTB38 ChIP-sequencing and matched Input samples at 3032 called ZBTB38 binding sites. (c) Heatmap representing binding intensities of ZBTB38 ChIP-sequencing and input samples at ZBTB38 binding sites. (d) Genomic distribution of ZBTB38 binding regions across the 10 chromatin states defined by a Hidden Markov Model using multiple histone modifications and genomic features. The asterisk indicates a P-value <10−3. (e) Venn diagram showing the overlap between ZBTB38 binding regions, transcription start sites (TSS), and CpG islands. (f) Venn diagram showing the overlay between ZBTB38 binding sites and CGI, CGI-shores, and CGI-shelves. (g) Box plot representing the relative size of CpG islands associated with ZBTB38 binding. P-value was calculated by Mann–Whitney/U-test.
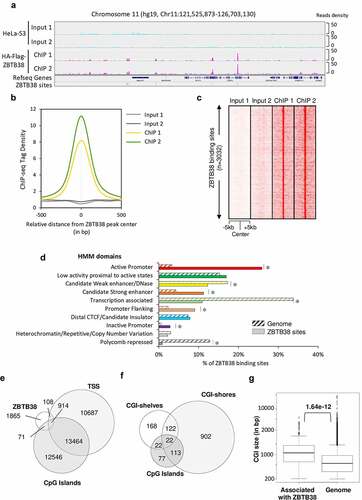
Figure 2. ZBTB38 binds upstream of CpG island of actively transcribed genes. (a) Average binding intensity of ZBTB38 ChIP-sequencing, phospho-Serine 5 Polymerase II (S5P) ChIP-sequencing, and input samples at TSS bound by ZBTB38 (left panel) and all TSS (right panel). (b) Average signal reads of CAGE at TSS bound by ZBTB38 (left panel) and all TSS (right panel). (c) Average intensity of histone-sequencing and input samples at TSS bound by ZBTB38 (left panel) and all TSS (right panel). (d) Average intensity of DNAseI-sequencing samples at TSS bound by ZBTB38 (left panel) and all TSS (right panel). (e) Association of ZBTB38 bound genes with transcriptomic studies present the Molecular Signatures Database. CML up-regulated are genes up-regulated in CD34+ cells isolated from bone marrow of CML (chronic myelogenous leukaemia) patients, compared to those from normal donors; HCC up-regulated are genes up-regulated in hepatocellular carcinoma (HCC) compared to normal liver samples; colon carcinoma up-regulated are genes up-regulated genes in colon carcinoma tumours compared to the matched normal mucosa samples; AML (rearranged MLL) up-regulated are genes up-regulated in paediatric AML (acute myeloid leukaemia) with rearranged MLL compared to all AML cases with the intact gene; Housekeeping are Housekeeping genes identified as expressed across 19 normal tissues; NPC down-regulated are genes down-regulated in nasopharyngeal carcinoma (NPC) compared to the normal tissue; MBD Knock-down up-regulated are genes up-regulated in HeLa cells after simultaneous knockdown of all three MBD (methyl-CpG binding domain) proteins MeCP2, MBD1 and MBD2 by RNAi. (f) Association of ZBTB38-bound genes with transcriptomic signatures of chemical alterations listed in the Molecular Signatures Database.
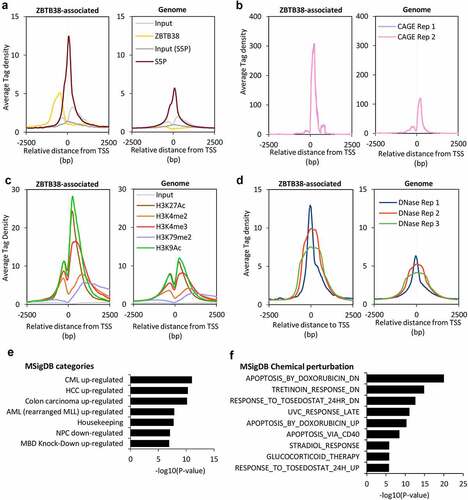
Figure 3. ZBTB38 binding sites contain a methylated CpG consensus. (a) Overlap between ZBTB38 binding regions and 63 chromatin binding factors in HeLa-S3 cells (ENCODE data). (b) De novo DNA motifs discovery in ZBTB38 binding regions using HOMER tools identify two sequence motifs: M1 (P-value of 1.0 × 10−453) and M2 (P-value of 1.0 × 10−198). The logo and enrichment statistics for M1 and M2 are presented. (c) Venn diagram indicating the proportion of ZBTB38 binding regions containing M1, M2, M1 + M2, or none of these motifs. (d) Average tag intensity of ZBTB38 ChIP-sequencing and Input samples in ZBTB38-bound regions containing M1, M2, M1 + M2, or none. (e) Genomic distribution of ZBTB38 binding regions containing M1, M2, M1 + M2, or none determined using HOMER tools. (f) Methylation level of the M1 motif at ZBTB38 binding regions (left panel) and at whole genome (right panel). (g) Methylation level of the M2 motif at ZBTB38 binding regions (left panel) and at whole genome (right panel). (h) Input DNAs, ZBTB38 ChIPed DNAs, and control IgG-bound DNAs were digested with BamHI and MluI prior to analysis on a 2% agarose gel stained with ethidium bromide. A control 72 base pair fragment without MluI and BamHI site was used as a control ChIP specificity.
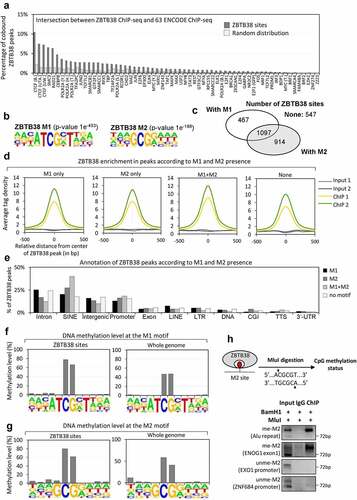
Figure 4. ZBTB38 binds the methylated M2 motif in vitro and it does not regulate its methylation in vivo. (a) Analysis of M2 motif methylation at two ZBTB38 binding sites and two control regions using the DNA methylation-sensitive MluI restriction enzyme. Genomic DNAs prepared from HeLa S3 cells transfected with siRNAs against ZBTB38 or control siRNAs were digested overnight by BamHI or BamHI+MluI and analysed by PCR amplification. (b) Analysis of M2 motif methylation at two ZBTB38 binding sites and two control regions using the DNA methylation-sensitive MluI restriction enzyme in HeLa-S3 cells expressing the HA-Flag-ZBTB38 protein and parental cells. (c) In vitro binding assays. GST-fusions of ZBTB38 central zinc fingers and mutated zinc fingers (H491R) or GST alone were incubated with equimolar mix of methylated, unmethylated, and mutated DNA probe containing the M2 motif. Left panel: relative quantification of methyl, unmethyl, and mutated level of DNAs recovered on the beads. Right panel: migration on agarose gel stained with ethidium bromide of total DNAs recovered on the beads prior enzymatic digestion.
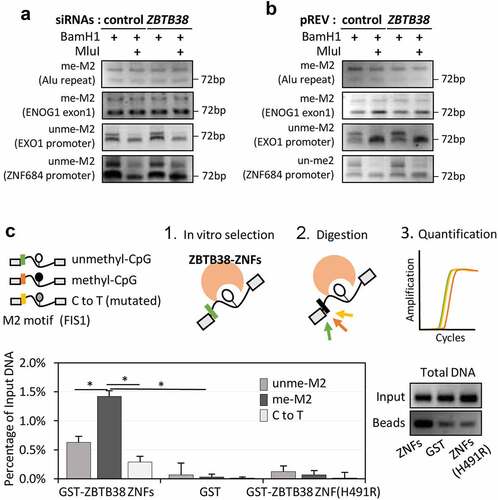
Figure 5. The M2 motif resembles an E2F4 binding consensus site but ZBTB38 targets are not cell cycle regulated. (a) Resemblance between the ZBTB38 M2 consensus and the E2F4 consensus sites derived from ChIP-sequencing analysis. (b) Average tag intensity of ZBTB38 ChIP-sequencing, E2F4 ChIP-sequencing, and input samples at ZBTB38 (left panel) and E2F4 (right panel) binding regions defined by the M2 motif. (c) Proportion of ZBTB38 and E2F4 peaks containing one or more unmethylathylated CpG (0%) or one or more fully methylated CpG (100%). (d) Profile of CpG methylation at the M2 motif in ZBTB38 (left panel) and E2F4 (right panel) binding regions. (e) Average intensity of DNAseI-sequencing reads at ZBTB38-bound (left panel) and E2F4-bound (right panel) regions. (f) Overlay between cyclically expressed genes in HeLa-S3 and targets of ZBTB38 and E2F4. The number of E2F4 and ZBTB38 targets present on the array and the actual number of genes intersecting with the list genes cyclically expressed are indicated as cyclic gene/total gene over the corresponding bars. (g) Overlay between genes activated at the G1/S transition in HeLa-S3 cells and targets of ZBTB38 and E2F4. (h) Overlay between housekeeping genes and targets of ZBTB38 and E2F4. (i) Overlay between tissue-specific genes and targets of ZBTB38 and E2F4.
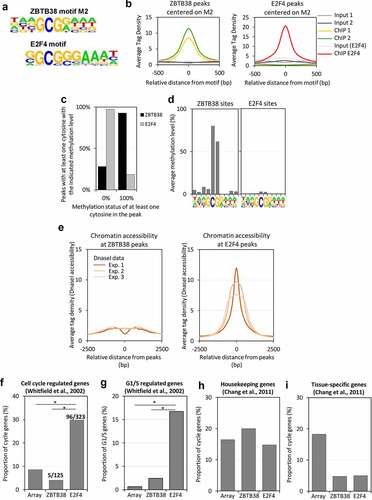
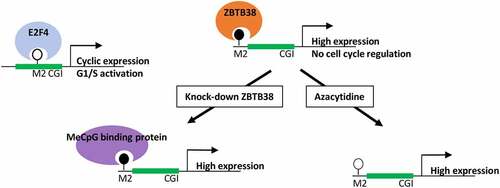
Figure 6. Model of gene expression regulation by ZBTB38 and M2 motif methylation. We find that ZBTB38 binds many genomic sites that are methylated, contain an M2 motif, and are located outside of CpG islands. E2F4, in contrast, binds sites containing an unmethylated M2 motif, proximal to genes that are cell-cycle regulated.
Supplemental Material
Download Zip (1.6 MB)Data availability statement
ChIP-sequencing data are available on NCBI GEO with accession number GSE108618. Software and pipelines used for analysis are listed in Materials and Methods section, and references are cited accordingly. Homemade analysis are available on https://github.com/ClaireMarchal.